Danish vs Immigrants from Senegal Child Poverty Under the Age of 5
COMPARE
Danish
Immigrants from Senegal
Child Poverty Under the Age of 5
Child Poverty Under the Age of 5 Comparison
Danes
Immigrants from Senegal
14.9%
CHILD POVERTY UNDER THE AGE OF 5
99.4/ 100
METRIC RATING
55th/ 347
METRIC RANK
21.3%
CHILD POVERTY UNDER THE AGE OF 5
0.0/ 100
METRIC RATING
288th/ 347
METRIC RANK
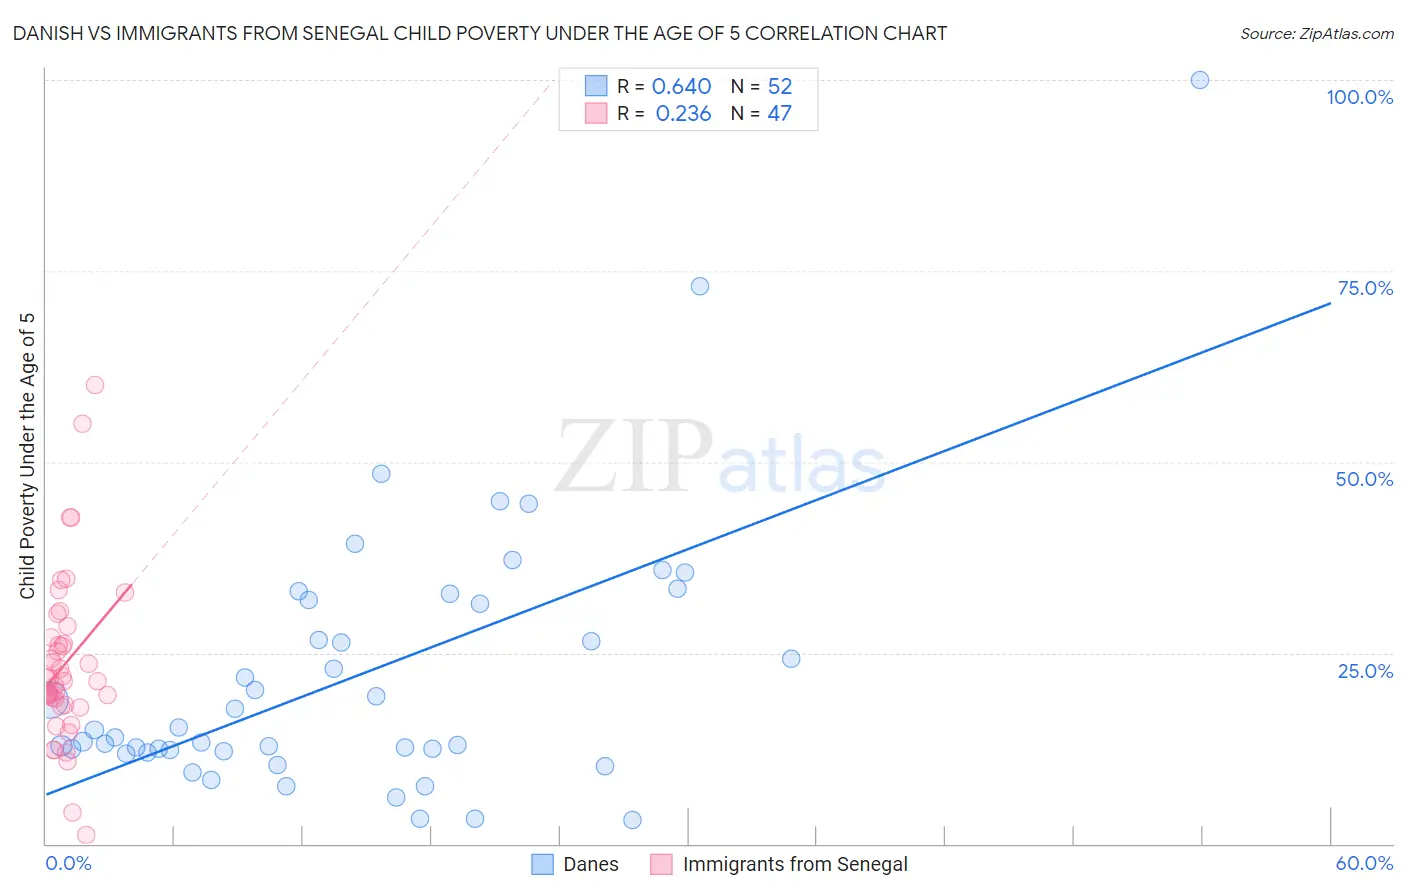
Danish vs Immigrants from Senegal Child Poverty Under the Age of 5 Correlation Chart
The statistical analysis conducted on geographies consisting of 447,094,806 people shows a significant positive correlation between the proportion of Danes and poverty level among children under the age of 5 in the United States with a correlation coefficient (R) of 0.640 and weighted average of 14.9%. Similarly, the statistical analysis conducted on geographies consisting of 89,495,365 people shows a weak positive correlation between the proportion of Immigrants from Senegal and poverty level among children under the age of 5 in the United States with a correlation coefficient (R) of 0.236 and weighted average of 21.3%, a difference of 42.6%.
Child Poverty Under the Age of 5 Correlation Summary
| Measurement | Danish | Immigrants from Senegal |
| Minimum | 3.2% | 1.2% |
| Maximum | 100.0% | 60.0% |
| Range | 96.8% | 58.8% |
| Mean | 22.1% | 23.5% |
| Median | 14.4% | 21.4% |
| Interquartile 25% (IQ1) | 12.2% | 18.1% |
| Interquartile 75% (IQ3) | 31.7% | 27.0% |
| Interquartile Range (IQR) | 19.5% | 8.9% |
| Standard Deviation (Sample) | 17.6% | 11.0% |
| Standard Deviation (Population) | 17.5% | 10.9% |
Similar Demographics by Child Poverty Under the Age of 5
Demographics Similar to Danes by Child Poverty Under the Age of 5
In terms of child poverty under the age of 5, the demographic groups most similar to Danes are Immigrants from Israel (14.9%, a difference of 0.060%), Luxembourger (14.9%, a difference of 0.070%), Immigrants from Pakistan (14.9%, a difference of 0.070%), Egyptian (14.9%, a difference of 0.15%), and Swedish (15.0%, a difference of 0.20%).
| Demographics | Rating | Rank | Child Poverty Under the Age of 5 |
| Immigrants | Czechoslovakia | 99.6 /100 | #48 | Exceptional 14.8% |
| Immigrants | Bulgaria | 99.6 /100 | #49 | Exceptional 14.8% |
| Immigrants | Northern Europe | 99.6 /100 | #50 | Exceptional 14.8% |
| Estonians | 99.6 /100 | #51 | Exceptional 14.8% |
| Immigrants | Serbia | 99.5 /100 | #52 | Exceptional 14.9% |
| Luxembourgers | 99.4 /100 | #53 | Exceptional 14.9% |
| Immigrants | Israel | 99.4 /100 | #54 | Exceptional 14.9% |
| Danes | 99.4 /100 | #55 | Exceptional 14.9% |
| Immigrants | Pakistan | 99.4 /100 | #56 | Exceptional 14.9% |
| Egyptians | 99.4 /100 | #57 | Exceptional 14.9% |
| Swedes | 99.4 /100 | #58 | Exceptional 15.0% |
| Paraguayans | 99.4 /100 | #59 | Exceptional 15.0% |
| Immigrants | Russia | 99.3 /100 | #60 | Exceptional 15.0% |
| Immigrants | Poland | 99.1 /100 | #61 | Exceptional 15.1% |
| Immigrants | Eastern Europe | 99.1 /100 | #62 | Exceptional 15.1% |
Demographics Similar to Immigrants from Senegal by Child Poverty Under the Age of 5
In terms of child poverty under the age of 5, the demographic groups most similar to Immigrants from Senegal are Immigrants from Haiti (21.3%, a difference of 0.070%), Immigrants from Zaire (21.3%, a difference of 0.17%), Immigrants from Latin America (21.2%, a difference of 0.27%), Haitian (21.2%, a difference of 0.34%), and Immigrants from Caribbean (21.4%, a difference of 0.48%).
| Demographics | Rating | Rank | Child Poverty Under the Age of 5 |
| Senegalese | 0.0 /100 | #281 | Tragic 20.9% |
| Potawatomi | 0.0 /100 | #282 | Tragic 21.0% |
| Comanche | 0.0 /100 | #283 | Tragic 21.0% |
| Somalis | 0.0 /100 | #284 | Tragic 21.1% |
| Haitians | 0.0 /100 | #285 | Tragic 21.2% |
| Immigrants | Latin America | 0.0 /100 | #286 | Tragic 21.2% |
| Immigrants | Zaire | 0.0 /100 | #287 | Tragic 21.3% |
| Immigrants | Senegal | 0.0 /100 | #288 | Tragic 21.3% |
| Immigrants | Haiti | 0.0 /100 | #289 | Tragic 21.3% |
| Immigrants | Caribbean | 0.0 /100 | #290 | Tragic 21.4% |
| British West Indians | 0.0 /100 | #291 | Tragic 21.4% |
| Immigrants | Somalia | 0.0 /100 | #292 | Tragic 21.6% |
| Mexicans | 0.0 /100 | #293 | Tragic 21.6% |
| Guatemalans | 0.0 /100 | #294 | Tragic 21.6% |
| Cherokee | 0.0 /100 | #295 | Tragic 21.7% |