Immigrants from Belize vs French American Indian Child Poverty Under the Age of 5
COMPARE
Immigrants from Belize
French American Indian
Child Poverty Under the Age of 5
Child Poverty Under the Age of 5 Comparison
Immigrants from Belize
French American Indians
20.6%
CHILD POVERTY UNDER THE AGE OF 5
0.1/ 100
METRIC RATING
274th/ 347
METRIC RANK
20.8%
CHILD POVERTY UNDER THE AGE OF 5
0.0/ 100
METRIC RATING
280th/ 347
METRIC RANK
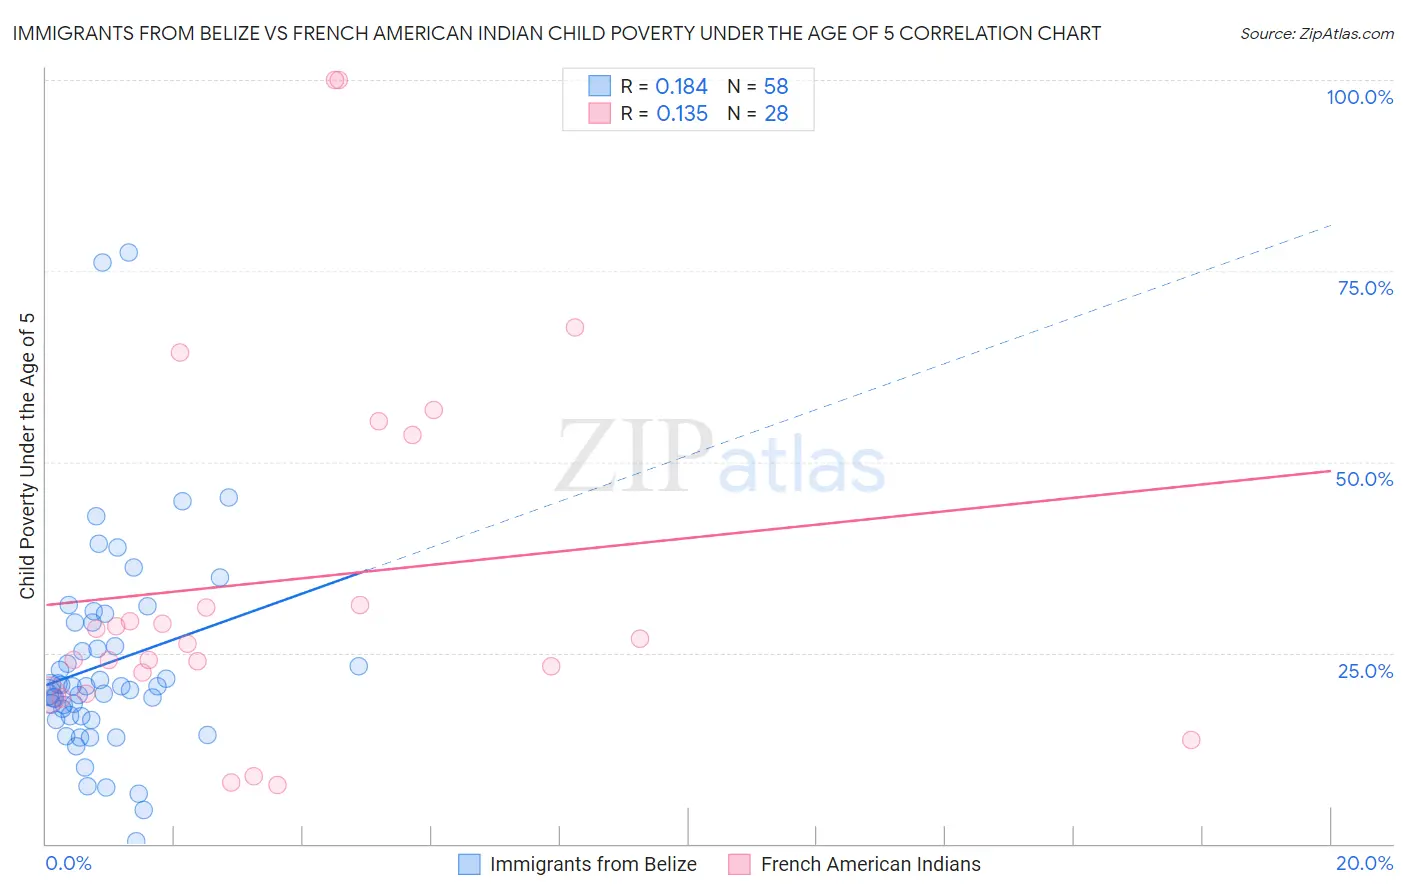
Immigrants from Belize vs French American Indian Child Poverty Under the Age of 5 Correlation Chart
The statistical analysis conducted on geographies consisting of 129,008,475 people shows a poor positive correlation between the proportion of Immigrants from Belize and poverty level among children under the age of 5 in the United States with a correlation coefficient (R) of 0.184 and weighted average of 20.6%. Similarly, the statistical analysis conducted on geographies consisting of 129,608,524 people shows a poor positive correlation between the proportion of French American Indians and poverty level among children under the age of 5 in the United States with a correlation coefficient (R) of 0.135 and weighted average of 20.8%, a difference of 1.1%.
Child Poverty Under the Age of 5 Correlation Summary
| Measurement | Immigrants from Belize | French American Indian |
| Minimum | 0.34% | 7.7% |
| Maximum | 77.4% | 100.0% |
| Range | 77.1% | 92.3% |
| Mean | 23.5% | 34.5% |
| Median | 20.6% | 26.5% |
| Interquartile 25% (IQ1) | 16.8% | 21.1% |
| Interquartile 75% (IQ3) | 28.9% | 42.4% |
| Interquartile Range (IQR) | 12.1% | 21.3% |
| Standard Deviation (Sample) | 13.9% | 24.4% |
| Standard Deviation (Population) | 13.8% | 23.9% |
Demographics Similar to Immigrants from Belize and French American Indians by Child Poverty Under the Age of 5
In terms of child poverty under the age of 5, the demographic groups most similar to Immigrants from Belize are Bangladeshi (20.6%, a difference of 0.050%), Central American (20.6%, a difference of 0.10%), West Indian (20.6%, a difference of 0.14%), Immigrants from West Indies (20.7%, a difference of 0.31%), and Immigrants from Grenada (20.7%, a difference of 0.33%). Similarly, the demographic groups most similar to French American Indians are Senegalese (20.9%, a difference of 0.23%), Subsaharan African (20.8%, a difference of 0.41%), Potawatomi (21.0%, a difference of 0.77%), Immigrants from Grenada (20.7%, a difference of 0.78%), and Immigrants from West Indies (20.7%, a difference of 0.80%).
| Demographics | Rating | Rank | Child Poverty Under the Age of 5 |
| Ottawa | 0.1 /100 | #267 | Tragic 20.3% |
| Belizeans | 0.1 /100 | #268 | Tragic 20.3% |
| Immigrants | Burma/Myanmar | 0.1 /100 | #269 | Tragic 20.4% |
| Jamaicans | 0.1 /100 | #270 | Tragic 20.4% |
| Americans | 0.1 /100 | #271 | Tragic 20.5% |
| Immigrants | Jamaica | 0.1 /100 | #272 | Tragic 20.5% |
| Central Americans | 0.1 /100 | #273 | Tragic 20.6% |
| Immigrants | Belize | 0.1 /100 | #274 | Tragic 20.6% |
| Bangladeshis | 0.1 /100 | #275 | Tragic 20.6% |
| West Indians | 0.0 /100 | #276 | Tragic 20.6% |
| Immigrants | West Indies | 0.0 /100 | #277 | Tragic 20.7% |
| Immigrants | Grenada | 0.0 /100 | #278 | Tragic 20.7% |
| Sub-Saharan Africans | 0.0 /100 | #279 | Tragic 20.8% |
| French American Indians | 0.0 /100 | #280 | Tragic 20.8% |
| Senegalese | 0.0 /100 | #281 | Tragic 20.9% |
| Potawatomi | 0.0 /100 | #282 | Tragic 21.0% |
| Comanche | 0.0 /100 | #283 | Tragic 21.0% |
| Somalis | 0.0 /100 | #284 | Tragic 21.1% |
| Haitians | 0.0 /100 | #285 | Tragic 21.2% |
| Immigrants | Latin America | 0.0 /100 | #286 | Tragic 21.2% |
| Immigrants | Zaire | 0.0 /100 | #287 | Tragic 21.3% |