Immigrants from Northern Europe vs Romanian Male Poverty
COMPARE
Immigrants from Northern Europe
Romanian
Male Poverty
Male Poverty Comparison
Immigrants from Northern Europe
Romanians
9.7%
MALE POVERTY
99.5/ 100
METRIC RATING
33rd/ 347
METRIC RANK
10.5%
MALE POVERTY
93.6/ 100
METRIC RATING
97th/ 347
METRIC RANK
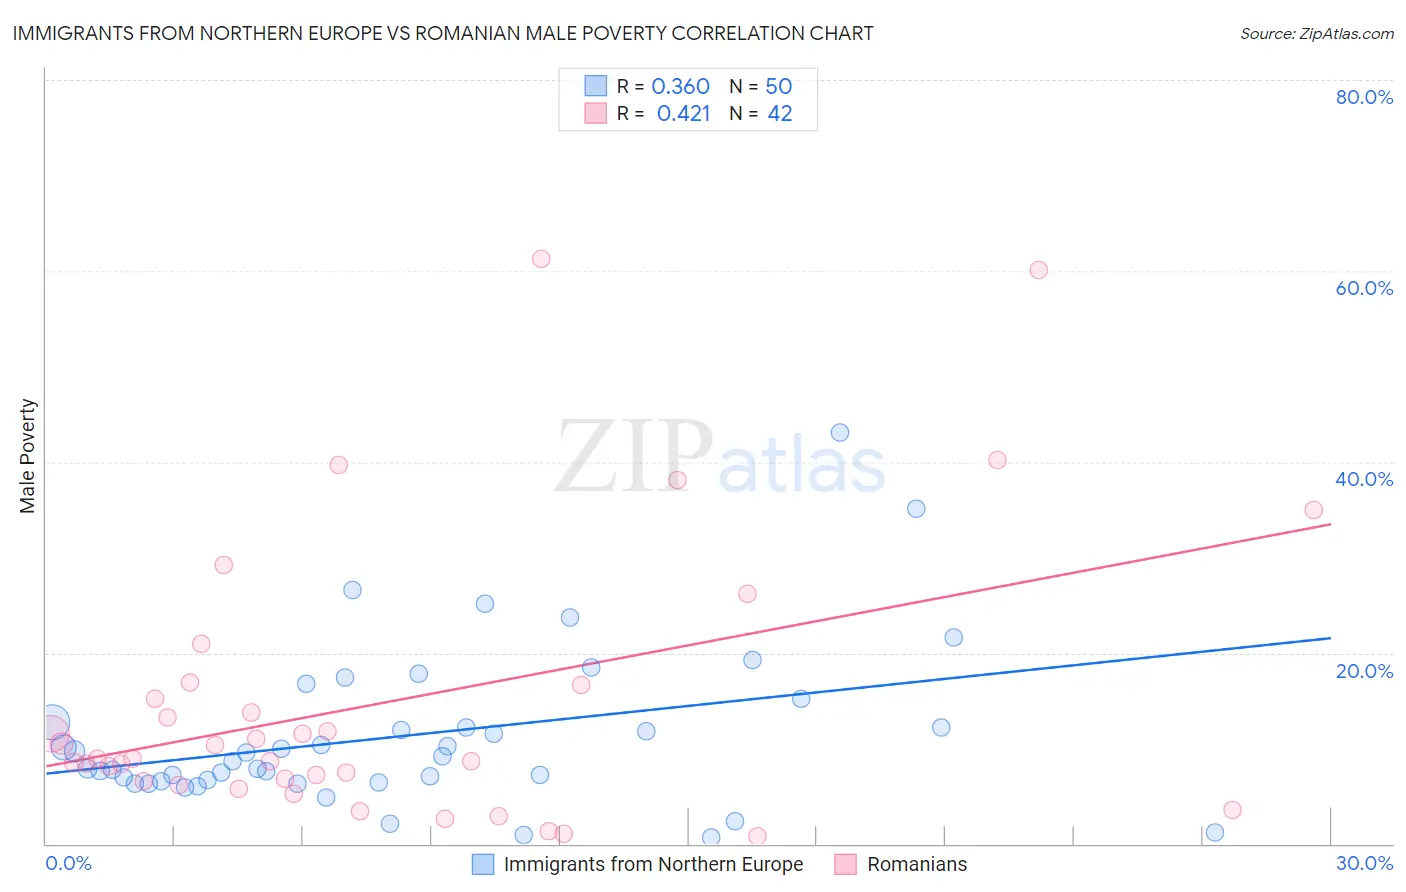
Immigrants from Northern Europe vs Romanian Male Poverty Correlation Chart
The statistical analysis conducted on geographies consisting of 476,600,632 people shows a mild positive correlation between the proportion of Immigrants from Northern Europe and poverty level among males in the United States with a correlation coefficient (R) of 0.360 and weighted average of 9.7%. Similarly, the statistical analysis conducted on geographies consisting of 377,566,833 people shows a moderate positive correlation between the proportion of Romanians and poverty level among males in the United States with a correlation coefficient (R) of 0.421 and weighted average of 10.5%, a difference of 7.3%.
Male Poverty Correlation Summary
| Measurement | Immigrants from Northern Europe | Romanian |
| Minimum | 0.64% | 0.81% |
| Maximum | 43.1% | 61.3% |
| Range | 42.5% | 60.5% |
| Mean | 11.3% | 14.8% |
| Median | 8.9% | 8.9% |
| Interquartile 25% (IQ1) | 6.5% | 6.5% |
| Interquartile 75% (IQ3) | 12.7% | 16.6% |
| Interquartile Range (IQR) | 6.2% | 10.1% |
| Standard Deviation (Sample) | 8.3% | 14.7% |
| Standard Deviation (Population) | 8.3% | 14.5% |
Similar Demographics by Male Poverty
Demographics Similar to Immigrants from Northern Europe by Male Poverty
In terms of male poverty, the demographic groups most similar to Immigrants from Northern Europe are Macedonian (9.7%, a difference of 0.090%), Immigrants from Poland (9.8%, a difference of 0.15%), Tongan (9.7%, a difference of 0.29%), Polish (9.7%, a difference of 0.31%), and Greek (9.7%, a difference of 0.39%).
| Demographics | Rating | Rank | Male Poverty |
| Burmese | 99.6 /100 | #26 | Exceptional 9.7% |
| Danes | 99.6 /100 | #27 | Exceptional 9.7% |
| Immigrants | Korea | 99.6 /100 | #28 | Exceptional 9.7% |
| Greeks | 99.6 /100 | #29 | Exceptional 9.7% |
| Poles | 99.5 /100 | #30 | Exceptional 9.7% |
| Tongans | 99.5 /100 | #31 | Exceptional 9.7% |
| Macedonians | 99.5 /100 | #32 | Exceptional 9.7% |
| Immigrants | Northern Europe | 99.5 /100 | #33 | Exceptional 9.7% |
| Immigrants | Poland | 99.5 /100 | #34 | Exceptional 9.8% |
| Iranians | 99.4 /100 | #35 | Exceptional 9.8% |
| Czechs | 99.4 /100 | #36 | Exceptional 9.8% |
| Immigrants | Greece | 99.3 /100 | #37 | Exceptional 9.8% |
| Immigrants | Pakistan | 99.2 /100 | #38 | Exceptional 9.9% |
| Russians | 99.2 /100 | #39 | Exceptional 9.9% |
| Cypriots | 99.2 /100 | #40 | Exceptional 9.9% |
Demographics Similar to Romanians by Male Poverty
In terms of male poverty, the demographic groups most similar to Romanians are Immigrants from Egypt (10.4%, a difference of 0.050%), Finnish (10.5%, a difference of 0.060%), Immigrants from Indonesia (10.5%, a difference of 0.13%), Scottish (10.4%, a difference of 0.18%), and Immigrants from South Africa (10.4%, a difference of 0.22%).
| Demographics | Rating | Rank | Male Poverty |
| Indians (Asian) | 94.9 /100 | #90 | Exceptional 10.4% |
| British | 94.8 /100 | #91 | Exceptional 10.4% |
| Jordanians | 94.4 /100 | #92 | Exceptional 10.4% |
| Australians | 94.4 /100 | #93 | Exceptional 10.4% |
| Immigrants | South Africa | 94.1 /100 | #94 | Exceptional 10.4% |
| Scottish | 94.0 /100 | #95 | Exceptional 10.4% |
| Immigrants | Egypt | 93.7 /100 | #96 | Exceptional 10.4% |
| Romanians | 93.6 /100 | #97 | Exceptional 10.5% |
| Finns | 93.4 /100 | #98 | Exceptional 10.5% |
| Immigrants | Indonesia | 93.3 /100 | #99 | Exceptional 10.5% |
| Immigrants | Latvia | 92.8 /100 | #100 | Exceptional 10.5% |
| Immigrants | Zimbabwe | 92.0 /100 | #101 | Exceptional 10.5% |
| French Canadians | 91.9 /100 | #102 | Exceptional 10.5% |
| Slavs | 91.7 /100 | #103 | Exceptional 10.5% |
| Welsh | 91.6 /100 | #104 | Exceptional 10.5% |