Immigrants from North America vs Immigrants from Scotland Poverty
COMPARE
Immigrants from North America
Immigrants from Scotland
Poverty
Poverty Comparison
Immigrants from North America
Immigrants from Scotland
11.3%
POVERTY
96.8/ 100
METRIC RATING
76th/ 347
METRIC RANK
10.6%
POVERTY
99.7/ 100
METRIC RATING
19th/ 347
METRIC RANK
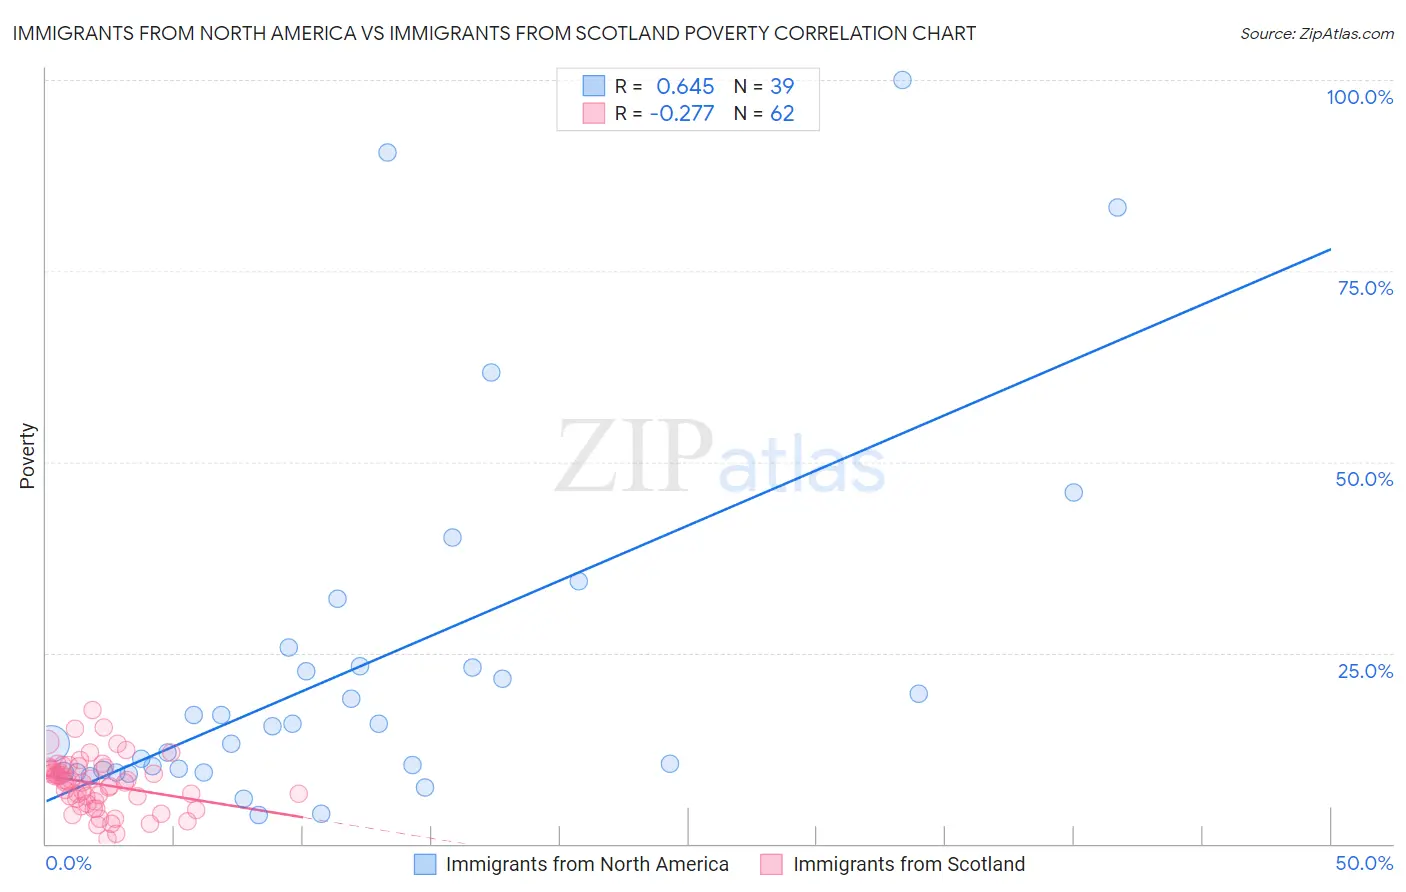
Immigrants from North America vs Immigrants from Scotland Poverty Correlation Chart
The statistical analysis conducted on geographies consisting of 462,172,327 people shows a significant positive correlation between the proportion of Immigrants from North America and poverty level in the United States with a correlation coefficient (R) of 0.645 and weighted average of 11.3%. Similarly, the statistical analysis conducted on geographies consisting of 196,384,756 people shows a weak negative correlation between the proportion of Immigrants from Scotland and poverty level in the United States with a correlation coefficient (R) of -0.277 and weighted average of 10.6%, a difference of 7.0%.
Poverty Correlation Summary
| Measurement | Immigrants from North America | Immigrants from Scotland |
| Minimum | 3.8% | 0.74% |
| Maximum | 100.0% | 17.6% |
| Range | 96.2% | 16.8% |
| Mean | 23.1% | 7.8% |
| Median | 15.4% | 8.2% |
| Interquartile 25% (IQ1) | 9.4% | 5.6% |
| Interquartile 75% (IQ3) | 23.2% | 9.9% |
| Interquartile Range (IQR) | 13.8% | 4.4% |
| Standard Deviation (Sample) | 23.3% | 3.5% |
| Standard Deviation (Population) | 23.0% | 3.4% |
Similar Demographics by Poverty
Demographics Similar to Immigrants from North America by Poverty
In terms of poverty, the demographic groups most similar to Immigrants from North America are Immigrants from Eastern Asia (11.3%, a difference of 0.070%), Dutch (11.3%, a difference of 0.080%), Cambodian (11.3%, a difference of 0.13%), Indian (Asian) (11.3%, a difference of 0.14%), and Immigrants from Eastern Europe (11.3%, a difference of 0.15%).
| Demographics | Rating | Rank | Poverty |
| Serbians | 97.4 /100 | #69 | Exceptional 11.2% |
| Immigrants | Canada | 97.3 /100 | #70 | Exceptional 11.3% |
| Zimbabweans | 97.3 /100 | #71 | Exceptional 11.3% |
| Europeans | 97.2 /100 | #72 | Exceptional 11.3% |
| Immigrants | Belgium | 97.2 /100 | #73 | Exceptional 11.3% |
| Carpatho Rusyns | 97.2 /100 | #74 | Exceptional 11.3% |
| Immigrants | Eastern Europe | 97.0 /100 | #75 | Exceptional 11.3% |
| Immigrants | North America | 96.8 /100 | #76 | Exceptional 11.3% |
| Immigrants | Eastern Asia | 96.7 /100 | #77 | Exceptional 11.3% |
| Dutch | 96.7 /100 | #78 | Exceptional 11.3% |
| Cambodians | 96.7 /100 | #79 | Exceptional 11.3% |
| Indians (Asian) | 96.6 /100 | #80 | Exceptional 11.3% |
| Irish | 96.6 /100 | #81 | Exceptional 11.3% |
| Egyptians | 96.5 /100 | #82 | Exceptional 11.3% |
| Immigrants | Sweden | 96.3 /100 | #83 | Exceptional 11.3% |
Demographics Similar to Immigrants from Scotland by Poverty
In terms of poverty, the demographic groups most similar to Immigrants from Scotland are Immigrants from North Macedonia (10.6%, a difference of 0.11%), Luxembourger (10.6%, a difference of 0.19%), Eastern European (10.6%, a difference of 0.35%), Latvian (10.5%, a difference of 0.39%), and Swedish (10.6%, a difference of 0.46%).
| Demographics | Rating | Rank | Poverty |
| Bhutanese | 99.8 /100 | #12 | Exceptional 10.4% |
| Immigrants | Hong Kong | 99.8 /100 | #13 | Exceptional 10.4% |
| Immigrants | Bolivia | 99.8 /100 | #14 | Exceptional 10.4% |
| Bolivians | 99.8 /100 | #15 | Exceptional 10.4% |
| Lithuanians | 99.8 /100 | #16 | Exceptional 10.5% |
| Norwegians | 99.8 /100 | #17 | Exceptional 10.5% |
| Latvians | 99.8 /100 | #18 | Exceptional 10.5% |
| Immigrants | Scotland | 99.7 /100 | #19 | Exceptional 10.6% |
| Immigrants | North Macedonia | 99.7 /100 | #20 | Exceptional 10.6% |
| Luxembourgers | 99.7 /100 | #21 | Exceptional 10.6% |
| Eastern Europeans | 99.7 /100 | #22 | Exceptional 10.6% |
| Swedes | 99.7 /100 | #23 | Exceptional 10.6% |
| Italians | 99.7 /100 | #24 | Exceptional 10.6% |
| Croatians | 99.6 /100 | #25 | Exceptional 10.6% |
| Burmese | 99.6 /100 | #26 | Exceptional 10.7% |