Immigrants from North America vs Yakama Poverty
COMPARE
Immigrants from North America
Yakama
Poverty
Poverty Comparison
Immigrants from North America
Yakama
11.3%
POVERTY
96.8/ 100
METRIC RATING
76th/ 347
METRIC RANK
16.7%
POVERTY
0.0/ 100
METRIC RATING
324th/ 347
METRIC RANK
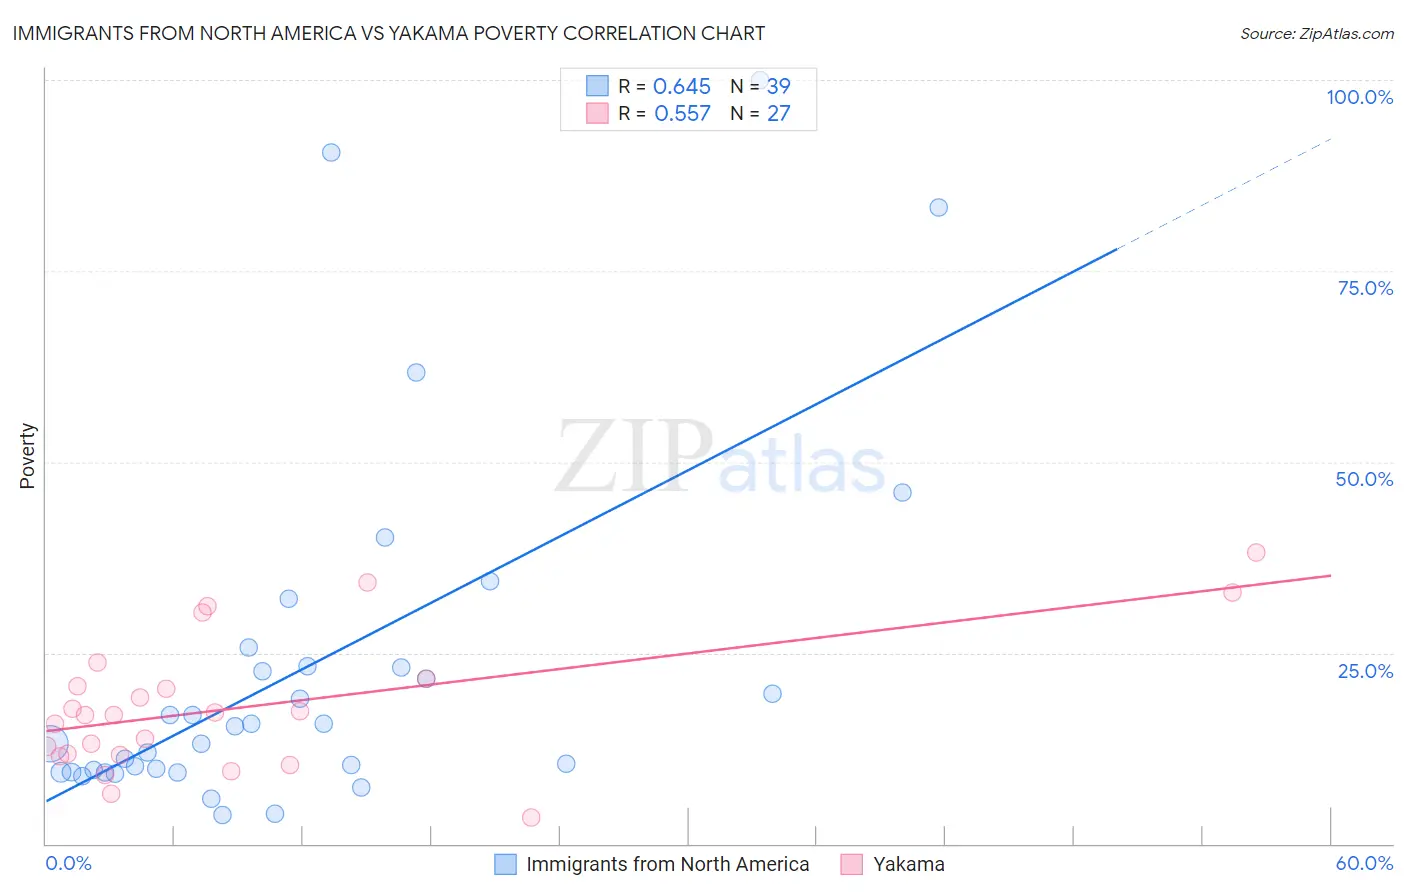
Immigrants from North America vs Yakama Poverty Correlation Chart
The statistical analysis conducted on geographies consisting of 462,172,327 people shows a significant positive correlation between the proportion of Immigrants from North America and poverty level in the United States with a correlation coefficient (R) of 0.645 and weighted average of 11.3%. Similarly, the statistical analysis conducted on geographies consisting of 19,917,879 people shows a substantial positive correlation between the proportion of Yakama and poverty level in the United States with a correlation coefficient (R) of 0.557 and weighted average of 16.7%, a difference of 47.4%.
Poverty Correlation Summary
| Measurement | Immigrants from North America | Yakama |
| Minimum | 3.8% | 3.5% |
| Maximum | 100.0% | 38.1% |
| Range | 96.2% | 34.6% |
| Mean | 23.1% | 18.0% |
| Median | 15.4% | 16.8% |
| Interquartile 25% (IQ1) | 9.4% | 11.7% |
| Interquartile 75% (IQ3) | 23.2% | 21.6% |
| Interquartile Range (IQR) | 13.8% | 9.9% |
| Standard Deviation (Sample) | 23.3% | 8.8% |
| Standard Deviation (Population) | 23.0% | 8.7% |
Similar Demographics by Poverty
Demographics Similar to Immigrants from North America by Poverty
In terms of poverty, the demographic groups most similar to Immigrants from North America are Immigrants from Eastern Asia (11.3%, a difference of 0.070%), Dutch (11.3%, a difference of 0.080%), Cambodian (11.3%, a difference of 0.13%), Indian (Asian) (11.3%, a difference of 0.14%), and Immigrants from Eastern Europe (11.3%, a difference of 0.15%).
| Demographics | Rating | Rank | Poverty |
| Serbians | 97.4 /100 | #69 | Exceptional 11.2% |
| Immigrants | Canada | 97.3 /100 | #70 | Exceptional 11.3% |
| Zimbabweans | 97.3 /100 | #71 | Exceptional 11.3% |
| Europeans | 97.2 /100 | #72 | Exceptional 11.3% |
| Immigrants | Belgium | 97.2 /100 | #73 | Exceptional 11.3% |
| Carpatho Rusyns | 97.2 /100 | #74 | Exceptional 11.3% |
| Immigrants | Eastern Europe | 97.0 /100 | #75 | Exceptional 11.3% |
| Immigrants | North America | 96.8 /100 | #76 | Exceptional 11.3% |
| Immigrants | Eastern Asia | 96.7 /100 | #77 | Exceptional 11.3% |
| Dutch | 96.7 /100 | #78 | Exceptional 11.3% |
| Cambodians | 96.7 /100 | #79 | Exceptional 11.3% |
| Indians (Asian) | 96.6 /100 | #80 | Exceptional 11.3% |
| Irish | 96.6 /100 | #81 | Exceptional 11.3% |
| Egyptians | 96.5 /100 | #82 | Exceptional 11.3% |
| Immigrants | Sweden | 96.3 /100 | #83 | Exceptional 11.3% |
Demographics Similar to Yakama by Poverty
In terms of poverty, the demographic groups most similar to Yakama are Central American Indian (16.7%, a difference of 0.23%), Paiute (16.7%, a difference of 0.52%), Colville (16.6%, a difference of 0.54%), Kiowa (16.8%, a difference of 1.1%), and Menominee (16.4%, a difference of 1.3%).
| Demographics | Rating | Rank | Poverty |
| U.S. Virgin Islanders | 0.0 /100 | #317 | Tragic 16.1% |
| Immigrants | Dominica | 0.0 /100 | #318 | Tragic 16.1% |
| Immigrants | Congo | 0.0 /100 | #319 | Tragic 16.1% |
| Immigrants | Honduras | 0.0 /100 | #320 | Tragic 16.2% |
| Arapaho | 0.0 /100 | #321 | Tragic 16.3% |
| Menominee | 0.0 /100 | #322 | Tragic 16.4% |
| Colville | 0.0 /100 | #323 | Tragic 16.6% |
| Yakama | 0.0 /100 | #324 | Tragic 16.7% |
| Central American Indians | 0.0 /100 | #325 | Tragic 16.7% |
| Paiute | 0.0 /100 | #326 | Tragic 16.7% |
| Kiowa | 0.0 /100 | #327 | Tragic 16.8% |
| Ute | 0.0 /100 | #328 | Tragic 16.9% |
| Blacks/African Americans | 0.0 /100 | #329 | Tragic 17.3% |
| Dominicans | 0.0 /100 | #330 | Tragic 17.6% |
| Immigrants | Dominican Republic | 0.0 /100 | #331 | Tragic 17.8% |