Immigrants from North America vs Bangladeshi Poverty
COMPARE
Immigrants from North America
Bangladeshi
Poverty
Poverty Comparison
Immigrants from North America
Bangladeshis
11.3%
POVERTY
96.8/ 100
METRIC RATING
76th/ 347
METRIC RANK
14.8%
POVERTY
0.0/ 100
METRIC RATING
277th/ 347
METRIC RANK
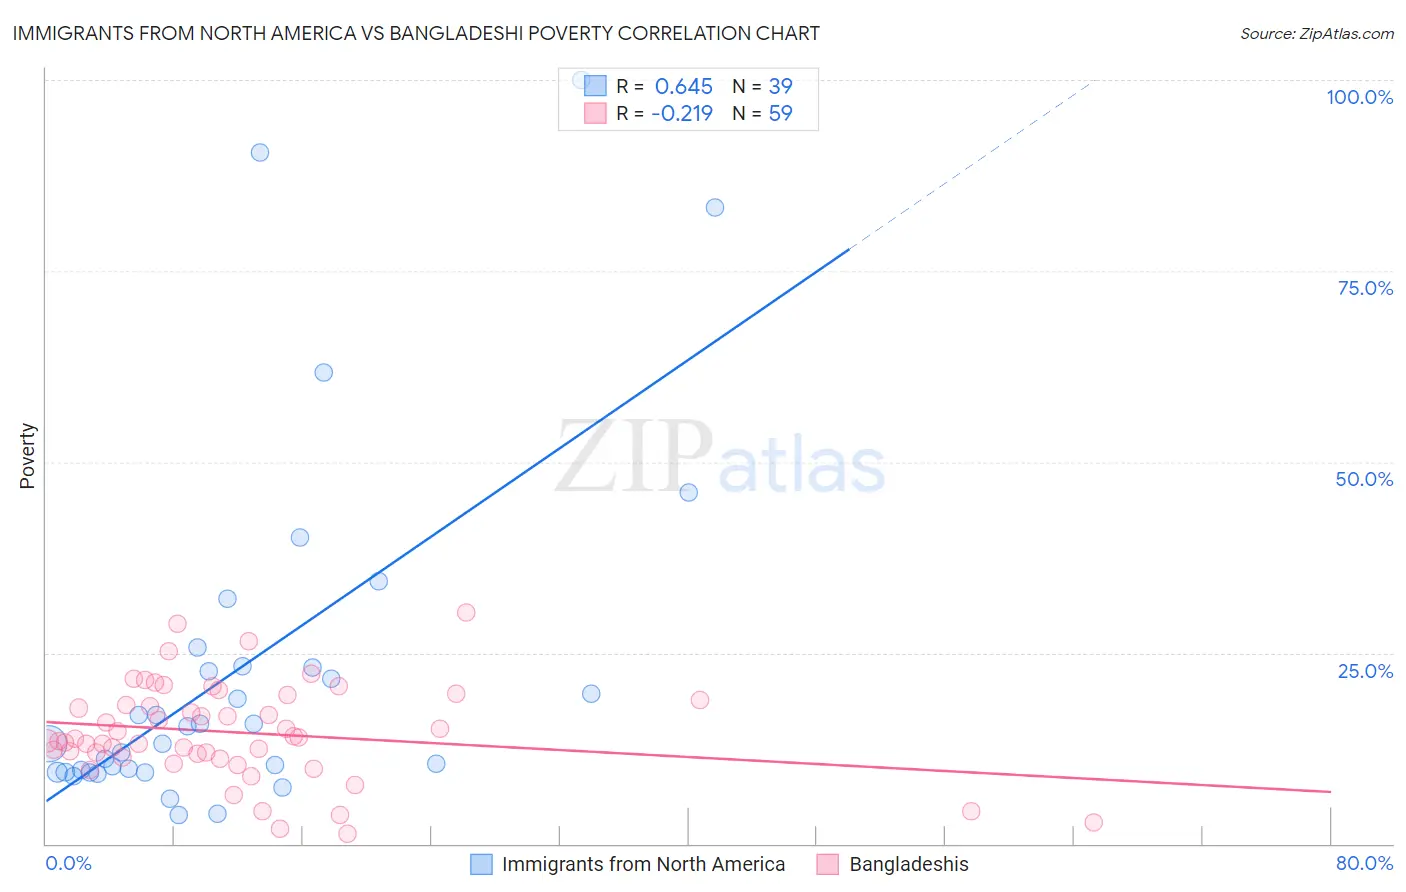
Immigrants from North America vs Bangladeshi Poverty Correlation Chart
The statistical analysis conducted on geographies consisting of 462,172,327 people shows a significant positive correlation between the proportion of Immigrants from North America and poverty level in the United States with a correlation coefficient (R) of 0.645 and weighted average of 11.3%. Similarly, the statistical analysis conducted on geographies consisting of 141,359,209 people shows a weak negative correlation between the proportion of Bangladeshis and poverty level in the United States with a correlation coefficient (R) of -0.219 and weighted average of 14.8%, a difference of 31.1%.
Poverty Correlation Summary
| Measurement | Immigrants from North America | Bangladeshi |
| Minimum | 3.8% | 1.3% |
| Maximum | 100.0% | 30.2% |
| Range | 96.2% | 28.9% |
| Mean | 23.1% | 14.6% |
| Median | 15.4% | 13.7% |
| Interquartile 25% (IQ1) | 9.4% | 11.4% |
| Interquartile 75% (IQ3) | 23.2% | 18.9% |
| Interquartile Range (IQR) | 13.8% | 7.5% |
| Standard Deviation (Sample) | 23.3% | 6.3% |
| Standard Deviation (Population) | 23.0% | 6.2% |
Similar Demographics by Poverty
Demographics Similar to Immigrants from North America by Poverty
In terms of poverty, the demographic groups most similar to Immigrants from North America are Immigrants from Eastern Asia (11.3%, a difference of 0.070%), Dutch (11.3%, a difference of 0.080%), Cambodian (11.3%, a difference of 0.13%), Indian (Asian) (11.3%, a difference of 0.14%), and Immigrants from Eastern Europe (11.3%, a difference of 0.15%).
| Demographics | Rating | Rank | Poverty |
| Serbians | 97.4 /100 | #69 | Exceptional 11.2% |
| Immigrants | Canada | 97.3 /100 | #70 | Exceptional 11.3% |
| Zimbabweans | 97.3 /100 | #71 | Exceptional 11.3% |
| Europeans | 97.2 /100 | #72 | Exceptional 11.3% |
| Immigrants | Belgium | 97.2 /100 | #73 | Exceptional 11.3% |
| Carpatho Rusyns | 97.2 /100 | #74 | Exceptional 11.3% |
| Immigrants | Eastern Europe | 97.0 /100 | #75 | Exceptional 11.3% |
| Immigrants | North America | 96.8 /100 | #76 | Exceptional 11.3% |
| Immigrants | Eastern Asia | 96.7 /100 | #77 | Exceptional 11.3% |
| Dutch | 96.7 /100 | #78 | Exceptional 11.3% |
| Cambodians | 96.7 /100 | #79 | Exceptional 11.3% |
| Indians (Asian) | 96.6 /100 | #80 | Exceptional 11.3% |
| Irish | 96.6 /100 | #81 | Exceptional 11.3% |
| Egyptians | 96.5 /100 | #82 | Exceptional 11.3% |
| Immigrants | Sweden | 96.3 /100 | #83 | Exceptional 11.3% |
Demographics Similar to Bangladeshis by Poverty
In terms of poverty, the demographic groups most similar to Bangladeshis are Belizean (14.8%, a difference of 0.020%), Immigrants from Bahamas (14.8%, a difference of 0.050%), Immigrants from West Indies (14.8%, a difference of 0.060%), Barbadian (14.8%, a difference of 0.090%), and Immigrants from St. Vincent and the Grenadines (14.9%, a difference of 0.31%).
| Demographics | Rating | Rank | Poverty |
| Central Americans | 0.1 /100 | #270 | Tragic 14.6% |
| Shoshone | 0.0 /100 | #271 | Tragic 14.7% |
| Chickasaw | 0.0 /100 | #272 | Tragic 14.7% |
| Spanish Americans | 0.0 /100 | #273 | Tragic 14.7% |
| Barbadians | 0.0 /100 | #274 | Tragic 14.8% |
| Immigrants | West Indies | 0.0 /100 | #275 | Tragic 14.8% |
| Immigrants | Bahamas | 0.0 /100 | #276 | Tragic 14.8% |
| Bangladeshis | 0.0 /100 | #277 | Tragic 14.8% |
| Belizeans | 0.0 /100 | #278 | Tragic 14.8% |
| Immigrants | St. Vincent and the Grenadines | 0.0 /100 | #279 | Tragic 14.9% |
| Haitians | 0.0 /100 | #280 | Tragic 14.9% |
| Immigrants | Barbados | 0.0 /100 | #281 | Tragic 14.9% |
| Comanche | 0.0 /100 | #282 | Tragic 15.0% |
| Immigrants | Haiti | 0.0 /100 | #283 | Tragic 15.0% |
| West Indians | 0.0 /100 | #284 | Tragic 15.0% |