Immigrants from North America vs Mexican Poverty
COMPARE
Immigrants from North America
Mexican
Poverty
Poverty Comparison
Immigrants from North America
Mexicans
11.3%
POVERTY
96.8/ 100
METRIC RATING
76th/ 347
METRIC RANK
15.1%
POVERTY
0.0/ 100
METRIC RATING
290th/ 347
METRIC RANK
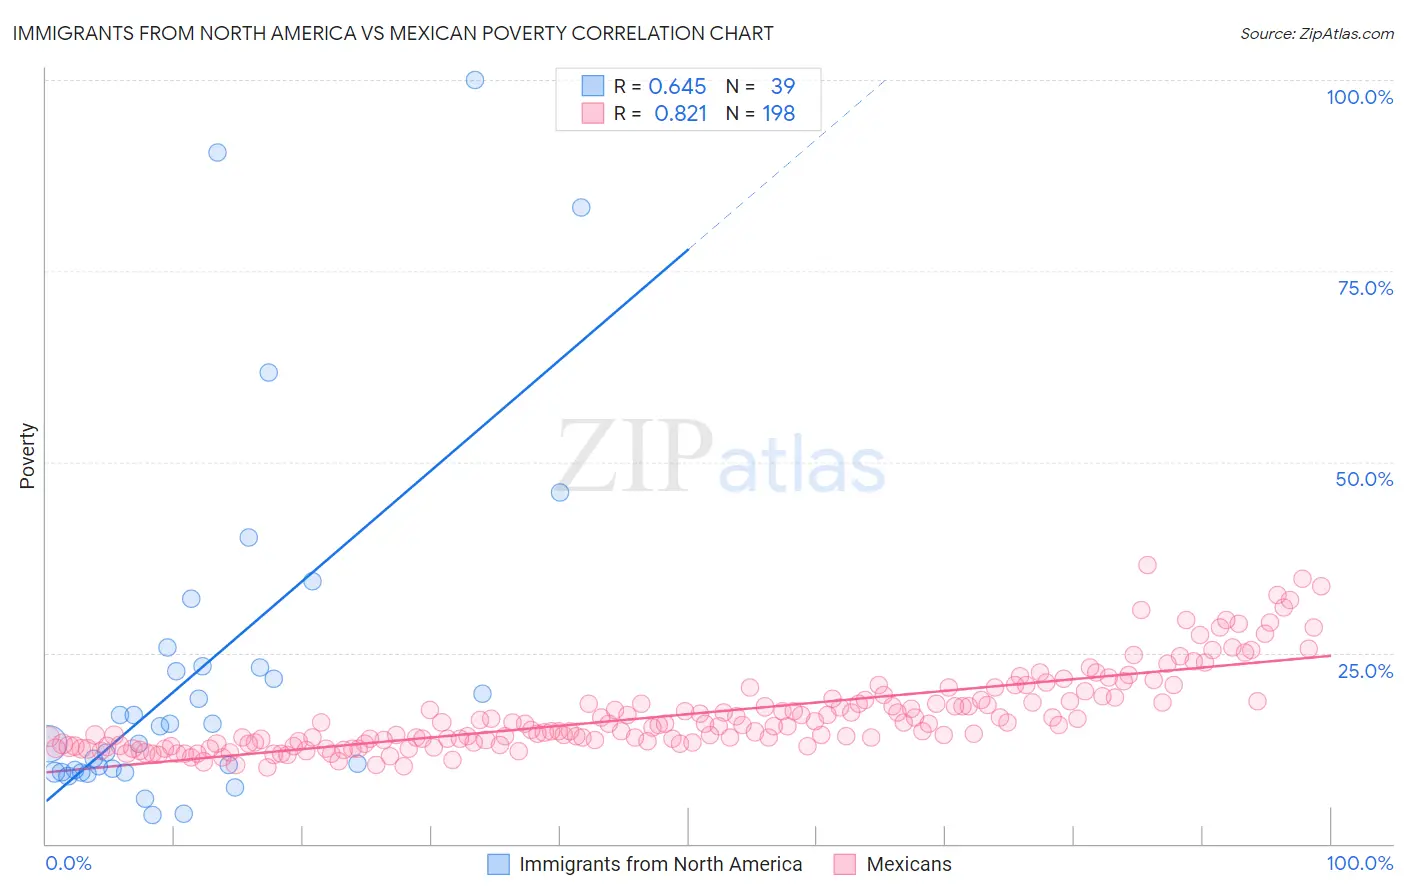
Immigrants from North America vs Mexican Poverty Correlation Chart
The statistical analysis conducted on geographies consisting of 462,172,327 people shows a significant positive correlation between the proportion of Immigrants from North America and poverty level in the United States with a correlation coefficient (R) of 0.645 and weighted average of 11.3%. Similarly, the statistical analysis conducted on geographies consisting of 564,427,713 people shows a very strong positive correlation between the proportion of Mexicans and poverty level in the United States with a correlation coefficient (R) of 0.821 and weighted average of 15.1%, a difference of 33.6%.
Poverty Correlation Summary
| Measurement | Immigrants from North America | Mexican |
| Minimum | 3.8% | 10.1% |
| Maximum | 100.0% | 36.5% |
| Range | 96.2% | 26.4% |
| Mean | 23.1% | 16.9% |
| Median | 15.4% | 15.4% |
| Interquartile 25% (IQ1) | 9.4% | 13.1% |
| Interquartile 75% (IQ3) | 23.2% | 18.7% |
| Interquartile Range (IQR) | 13.8% | 5.6% |
| Standard Deviation (Sample) | 23.3% | 5.3% |
| Standard Deviation (Population) | 23.0% | 5.3% |
Similar Demographics by Poverty
Demographics Similar to Immigrants from North America by Poverty
In terms of poverty, the demographic groups most similar to Immigrants from North America are Immigrants from Eastern Asia (11.3%, a difference of 0.070%), Dutch (11.3%, a difference of 0.080%), Cambodian (11.3%, a difference of 0.13%), Indian (Asian) (11.3%, a difference of 0.14%), and Immigrants from Eastern Europe (11.3%, a difference of 0.15%).
| Demographics | Rating | Rank | Poverty |
| Serbians | 97.4 /100 | #69 | Exceptional 11.2% |
| Immigrants | Canada | 97.3 /100 | #70 | Exceptional 11.3% |
| Zimbabweans | 97.3 /100 | #71 | Exceptional 11.3% |
| Europeans | 97.2 /100 | #72 | Exceptional 11.3% |
| Immigrants | Belgium | 97.2 /100 | #73 | Exceptional 11.3% |
| Carpatho Rusyns | 97.2 /100 | #74 | Exceptional 11.3% |
| Immigrants | Eastern Europe | 97.0 /100 | #75 | Exceptional 11.3% |
| Immigrants | North America | 96.8 /100 | #76 | Exceptional 11.3% |
| Immigrants | Eastern Asia | 96.7 /100 | #77 | Exceptional 11.3% |
| Dutch | 96.7 /100 | #78 | Exceptional 11.3% |
| Cambodians | 96.7 /100 | #79 | Exceptional 11.3% |
| Indians (Asian) | 96.6 /100 | #80 | Exceptional 11.3% |
| Irish | 96.6 /100 | #81 | Exceptional 11.3% |
| Egyptians | 96.5 /100 | #82 | Exceptional 11.3% |
| Immigrants | Sweden | 96.3 /100 | #83 | Exceptional 11.3% |
Demographics Similar to Mexicans by Poverty
In terms of poverty, the demographic groups most similar to Mexicans are Immigrants from Belize (15.1%, a difference of 0.10%), Immigrants from Cabo Verde (15.1%, a difference of 0.13%), Indonesian (15.1%, a difference of 0.18%), Immigrants from Zaire (15.1%, a difference of 0.18%), and Yaqui (15.1%, a difference of 0.22%).
| Demographics | Rating | Rank | Poverty |
| Immigrants | Haiti | 0.0 /100 | #283 | Tragic 15.0% |
| West Indians | 0.0 /100 | #284 | Tragic 15.0% |
| Vietnamese | 0.0 /100 | #285 | Tragic 15.0% |
| Immigrants | Latin America | 0.0 /100 | #286 | Tragic 15.0% |
| Inupiat | 0.0 /100 | #287 | Tragic 15.1% |
| Yaqui | 0.0 /100 | #288 | Tragic 15.1% |
| Immigrants | Belize | 0.0 /100 | #289 | Tragic 15.1% |
| Mexicans | 0.0 /100 | #290 | Tragic 15.1% |
| Immigrants | Cabo Verde | 0.0 /100 | #291 | Tragic 15.1% |
| Indonesians | 0.0 /100 | #292 | Tragic 15.1% |
| Immigrants | Zaire | 0.0 /100 | #293 | Tragic 15.1% |
| Blackfeet | 0.0 /100 | #294 | Tragic 15.2% |
| Guatemalans | 0.0 /100 | #295 | Tragic 15.3% |
| Hispanics or Latinos | 0.0 /100 | #296 | Tragic 15.3% |
| Immigrants | Bangladesh | 0.0 /100 | #297 | Tragic 15.3% |