Immigrants from Netherlands vs Mexican American Indian Single Female Poverty
COMPARE
Immigrants from Netherlands
Mexican American Indian
Single Female Poverty
Single Female Poverty Comparison
Immigrants from Netherlands
Mexican American Indians
20.0%
SINGLE FEMALE POVERTY
96.0/ 100
METRIC RATING
112th/ 347
METRIC RANK
23.4%
SINGLE FEMALE POVERTY
0.1/ 100
METRIC RATING
275th/ 347
METRIC RANK
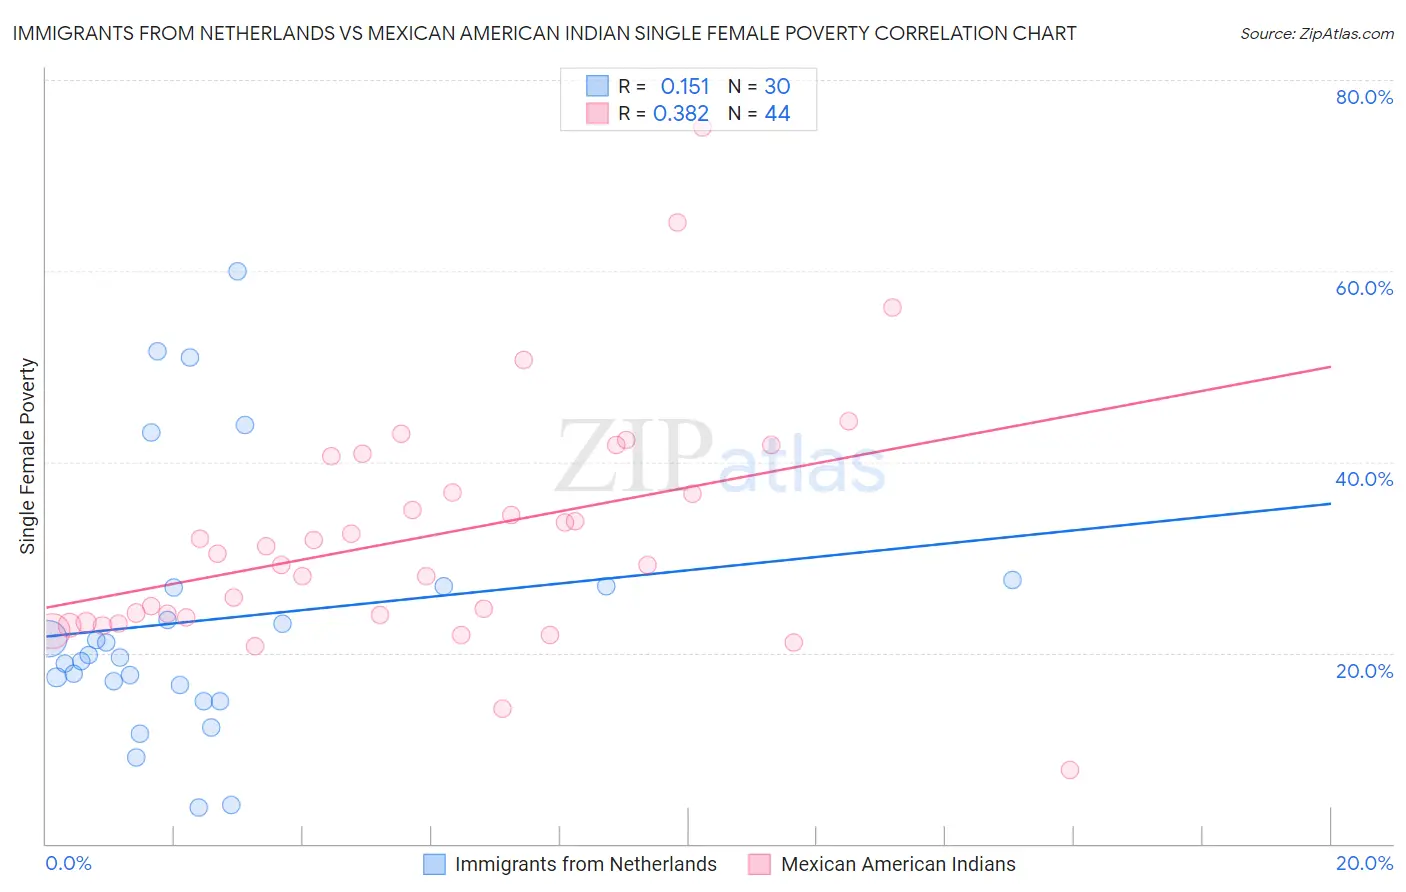
Immigrants from Netherlands vs Mexican American Indian Single Female Poverty Correlation Chart
The statistical analysis conducted on geographies consisting of 234,903,097 people shows a poor positive correlation between the proportion of Immigrants from Netherlands and poverty level among single females in the United States with a correlation coefficient (R) of 0.151 and weighted average of 20.0%. Similarly, the statistical analysis conducted on geographies consisting of 315,510,714 people shows a mild positive correlation between the proportion of Mexican American Indians and poverty level among single females in the United States with a correlation coefficient (R) of 0.382 and weighted average of 23.4%, a difference of 17.0%.
Single Female Poverty Correlation Summary
| Measurement | Immigrants from Netherlands | Mexican American Indian |
| Minimum | 3.8% | 7.7% |
| Maximum | 60.0% | 75.0% |
| Range | 56.2% | 67.3% |
| Mean | 23.4% | 32.2% |
| Median | 19.7% | 29.8% |
| Interquartile 25% (IQ1) | 16.7% | 23.5% |
| Interquartile 75% (IQ3) | 27.0% | 38.6% |
| Interquartile Range (IQR) | 10.4% | 15.2% |
| Standard Deviation (Sample) | 13.6% | 12.7% |
| Standard Deviation (Population) | 13.4% | 12.5% |
Similar Demographics by Single Female Poverty
Demographics Similar to Immigrants from Netherlands by Single Female Poverty
In terms of single female poverty, the demographic groups most similar to Immigrants from Netherlands are Immigrants from Zimbabwe (20.0%, a difference of 0.050%), Carpatho Rusyn (20.0%, a difference of 0.060%), Immigrants from Colombia (20.0%, a difference of 0.060%), Immigrants from Northern Africa (20.0%, a difference of 0.070%), and Immigrants from Kazakhstan (20.0%, a difference of 0.11%).
| Demographics | Rating | Rank | Single Female Poverty |
| Israelis | 96.9 /100 | #105 | Exceptional 19.9% |
| Ethiopians | 96.7 /100 | #106 | Exceptional 19.9% |
| Immigrants | Syria | 96.7 /100 | #107 | Exceptional 19.9% |
| Native Hawaiians | 96.6 /100 | #108 | Exceptional 19.9% |
| Colombians | 96.6 /100 | #109 | Exceptional 19.9% |
| Immigrants | Western Asia | 96.5 /100 | #110 | Exceptional 19.9% |
| Carpatho Rusyns | 96.1 /100 | #111 | Exceptional 20.0% |
| Immigrants | Netherlands | 96.0 /100 | #112 | Exceptional 20.0% |
| Immigrants | Zimbabwe | 95.9 /100 | #113 | Exceptional 20.0% |
| Immigrants | Colombia | 95.9 /100 | #114 | Exceptional 20.0% |
| Immigrants | Northern Africa | 95.8 /100 | #115 | Exceptional 20.0% |
| Immigrants | Kazakhstan | 95.7 /100 | #116 | Exceptional 20.0% |
| Poles | 95.6 /100 | #117 | Exceptional 20.0% |
| Immigrants | Afghanistan | 95.4 /100 | #118 | Exceptional 20.0% |
| Immigrants | Ethiopia | 95.4 /100 | #119 | Exceptional 20.0% |
Demographics Similar to Mexican American Indians by Single Female Poverty
In terms of single female poverty, the demographic groups most similar to Mexican American Indians are Alaska Native (23.3%, a difference of 0.27%), Marshallese (23.3%, a difference of 0.27%), Immigrants from Senegal (23.2%, a difference of 0.53%), Subsaharan African (23.2%, a difference of 0.71%), and Immigrants from the Azores (23.5%, a difference of 0.78%).
| Demographics | Rating | Rank | Single Female Poverty |
| Fijians | 0.2 /100 | #268 | Tragic 23.1% |
| Hmong | 0.2 /100 | #269 | Tragic 23.1% |
| Inupiat | 0.2 /100 | #270 | Tragic 23.1% |
| Sub-Saharan Africans | 0.1 /100 | #271 | Tragic 23.2% |
| Immigrants | Senegal | 0.1 /100 | #272 | Tragic 23.2% |
| Alaska Natives | 0.1 /100 | #273 | Tragic 23.3% |
| Marshallese | 0.1 /100 | #274 | Tragic 23.3% |
| Mexican American Indians | 0.1 /100 | #275 | Tragic 23.4% |
| Immigrants | Azores | 0.0 /100 | #276 | Tragic 23.5% |
| Pennsylvania Germans | 0.0 /100 | #277 | Tragic 23.6% |
| Immigrants | Nonimmigrants | 0.0 /100 | #278 | Tragic 23.6% |
| Alaskan Athabascans | 0.0 /100 | #279 | Tragic 23.6% |
| Immigrants | Latin America | 0.0 /100 | #280 | Tragic 23.7% |
| Immigrants | Zaire | 0.0 /100 | #281 | Tragic 23.8% |
| Guatemalans | 0.0 /100 | #282 | Tragic 23.8% |