Immigrants from Morocco vs Trinidadian and Tobagonian Disability Age Over 75
COMPARE
Immigrants from Morocco
Trinidadian and Tobagonian
Disability Age Over 75
Disability Age Over 75 Comparison
Immigrants from Morocco
Trinidadians and Tobagonians
47.1%
DISABILITY AGE OVER 75
71.4/ 100
METRIC RATING
159th/ 347
METRIC RANK
47.7%
DISABILITY AGE OVER 75
20.0/ 100
METRIC RATING
203rd/ 347
METRIC RANK
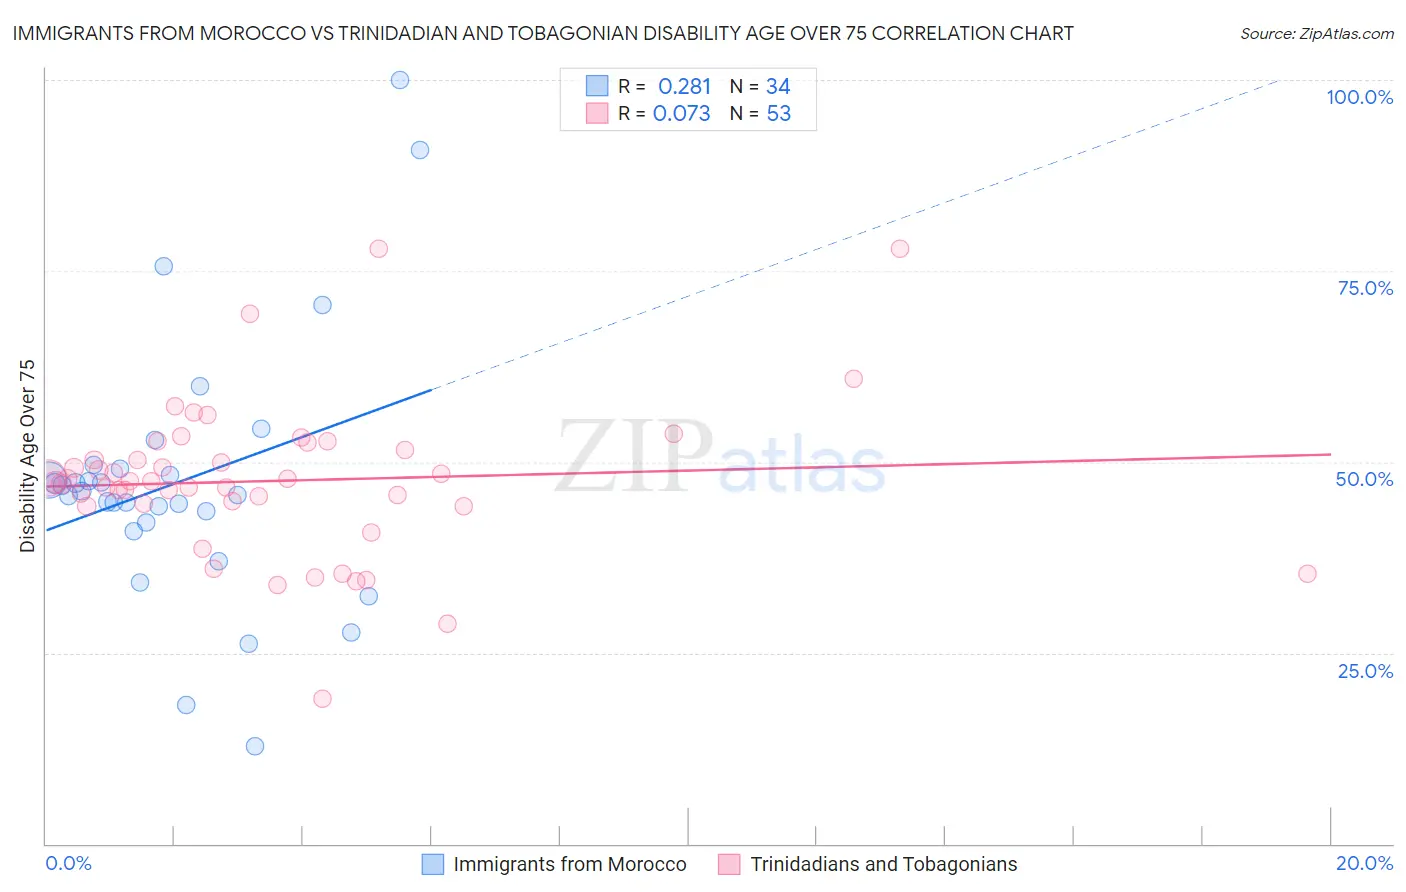
Immigrants from Morocco vs Trinidadian and Tobagonian Disability Age Over 75 Correlation Chart
The statistical analysis conducted on geographies consisting of 178,881,213 people shows a weak positive correlation between the proportion of Immigrants from Morocco and percentage of population with a disability over the age of 75 in the United States with a correlation coefficient (R) of 0.281 and weighted average of 47.1%. Similarly, the statistical analysis conducted on geographies consisting of 219,483,630 people shows a slight positive correlation between the proportion of Trinidadians and Tobagonians and percentage of population with a disability over the age of 75 in the United States with a correlation coefficient (R) of 0.073 and weighted average of 47.7%, a difference of 1.3%.
Disability Age Over 75 Correlation Summary
| Measurement | Immigrants from Morocco | Trinidadian and Tobagonian |
| Minimum | 12.8% | 18.9% |
| Maximum | 100.0% | 77.9% |
| Range | 87.2% | 59.0% |
| Mean | 47.3% | 47.5% |
| Median | 45.9% | 47.4% |
| Interquartile 25% (IQ1) | 42.1% | 44.3% |
| Interquartile 75% (IQ3) | 49.1% | 52.0% |
| Interquartile Range (IQR) | 7.0% | 7.7% |
| Standard Deviation (Sample) | 17.2% | 10.2% |
| Standard Deviation (Population) | 17.0% | 10.1% |
Similar Demographics by Disability Age Over 75
Demographics Similar to Immigrants from Morocco by Disability Age Over 75
In terms of disability age over 75, the demographic groups most similar to Immigrants from Morocco are Immigrants from Guyana (47.1%, a difference of 0.010%), Bhutanese (47.1%, a difference of 0.030%), Arab (47.1%, a difference of 0.050%), Immigrants from Middle Africa (47.1%, a difference of 0.080%), and Immigrants from Iran (47.1%, a difference of 0.090%).
| Demographics | Rating | Rank | Disability Age Over 75 |
| Immigrants | Asia | 76.5 /100 | #152 | Good 47.0% |
| Immigrants | Zaire | 74.8 /100 | #153 | Good 47.1% |
| Immigrants | Belarus | 74.8 /100 | #154 | Good 47.1% |
| Immigrants | Iran | 74.7 /100 | #155 | Good 47.1% |
| Arabs | 73.3 /100 | #156 | Good 47.1% |
| Bhutanese | 72.6 /100 | #157 | Good 47.1% |
| Immigrants | Guyana | 71.9 /100 | #158 | Good 47.1% |
| Immigrants | Morocco | 71.4 /100 | #159 | Good 47.1% |
| Immigrants | Middle Africa | 68.3 /100 | #160 | Good 47.1% |
| South American Indians | 68.1 /100 | #161 | Good 47.1% |
| Pennsylvania Germans | 66.0 /100 | #162 | Good 47.2% |
| Immigrants | Eastern Africa | 65.5 /100 | #163 | Good 47.2% |
| French | 64.6 /100 | #164 | Good 47.2% |
| Immigrants | Zimbabwe | 64.4 /100 | #165 | Good 47.2% |
| Immigrants | Sierra Leone | 64.4 /100 | #166 | Good 47.2% |
Demographics Similar to Trinidadians and Tobagonians by Disability Age Over 75
In terms of disability age over 75, the demographic groups most similar to Trinidadians and Tobagonians are Immigrants from Bahamas (47.7%, a difference of 0.020%), Immigrants from Cuba (47.7%, a difference of 0.030%), Nigerian (47.7%, a difference of 0.030%), Immigrants from Ghana (47.7%, a difference of 0.030%), and Jamaican (47.7%, a difference of 0.040%).
| Demographics | Rating | Rank | Disability Age Over 75 |
| Immigrants | Portugal | 23.8 /100 | #196 | Fair 47.6% |
| Pakistanis | 23.4 /100 | #197 | Fair 47.7% |
| Immigrants | Ukraine | 23.2 /100 | #198 | Fair 47.7% |
| Immigrants | Eritrea | 22.4 /100 | #199 | Fair 47.7% |
| Immigrants | Somalia | 21.4 /100 | #200 | Fair 47.7% |
| Immigrants | Cuba | 20.9 /100 | #201 | Fair 47.7% |
| Immigrants | Bahamas | 20.7 /100 | #202 | Fair 47.7% |
| Trinidadians and Tobagonians | 20.0 /100 | #203 | Fair 47.7% |
| Nigerians | 19.2 /100 | #204 | Poor 47.7% |
| Immigrants | Ghana | 19.1 /100 | #205 | Poor 47.7% |
| Jamaicans | 19.0 /100 | #206 | Poor 47.7% |
| Immigrants | Syria | 17.4 /100 | #207 | Poor 47.8% |
| Immigrants | Senegal | 16.9 /100 | #208 | Poor 47.8% |
| Immigrants | Indonesia | 14.2 /100 | #209 | Poor 47.8% |
| Vietnamese | 11.9 /100 | #210 | Poor 47.9% |