Immigrants from Sweden vs Trinidadian and Tobagonian Poverty
COMPARE
Immigrants from Sweden
Trinidadian and Tobagonian
Poverty
Poverty Comparison
Immigrants from Sweden
Trinidadians and Tobagonians
11.3%
POVERTY
96.3/ 100
METRIC RATING
83rd/ 347
METRIC RANK
14.3%
POVERTY
0.1/ 100
METRIC RATING
257th/ 347
METRIC RANK
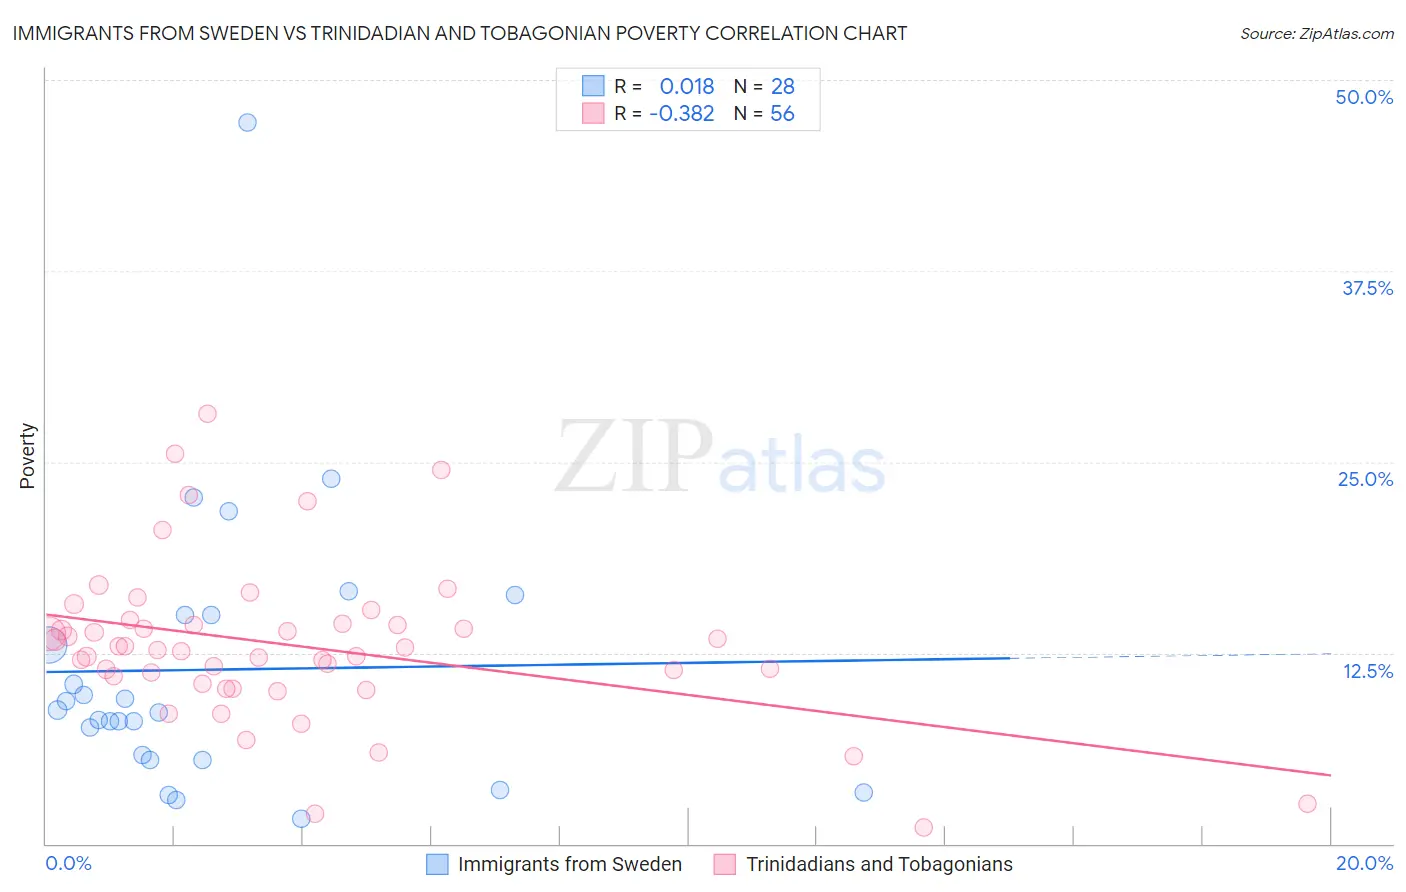
Immigrants from Sweden vs Trinidadian and Tobagonian Poverty Correlation Chart
The statistical analysis conducted on geographies consisting of 164,694,810 people shows no correlation between the proportion of Immigrants from Sweden and poverty level in the United States with a correlation coefficient (R) of 0.018 and weighted average of 11.3%. Similarly, the statistical analysis conducted on geographies consisting of 219,718,536 people shows a mild negative correlation between the proportion of Trinidadians and Tobagonians and poverty level in the United States with a correlation coefficient (R) of -0.382 and weighted average of 14.3%, a difference of 26.0%.
Poverty Correlation Summary
| Measurement | Immigrants from Sweden | Trinidadian and Tobagonian |
| Minimum | 1.7% | 1.0% |
| Maximum | 47.2% | 28.1% |
| Range | 45.6% | 27.1% |
| Mean | 11.4% | 13.0% |
| Median | 8.7% | 12.8% |
| Interquartile 25% (IQ1) | 5.7% | 10.7% |
| Interquartile 75% (IQ3) | 15.0% | 14.4% |
| Interquartile Range (IQR) | 9.3% | 3.7% |
| Standard Deviation (Sample) | 9.2% | 5.2% |
| Standard Deviation (Population) | 9.1% | 5.1% |
Similar Demographics by Poverty
Demographics Similar to Immigrants from Sweden by Poverty
In terms of poverty, the demographic groups most similar to Immigrants from Sweden are English (11.3%, a difference of 0.010%), Immigrants from England (11.4%, a difference of 0.080%), Egyptian (11.3%, a difference of 0.18%), Jordanian (11.4%, a difference of 0.19%), and Northern European (11.4%, a difference of 0.20%).
| Demographics | Rating | Rank | Poverty |
| Immigrants | North America | 96.8 /100 | #76 | Exceptional 11.3% |
| Immigrants | Eastern Asia | 96.7 /100 | #77 | Exceptional 11.3% |
| Dutch | 96.7 /100 | #78 | Exceptional 11.3% |
| Cambodians | 96.7 /100 | #79 | Exceptional 11.3% |
| Indians (Asian) | 96.6 /100 | #80 | Exceptional 11.3% |
| Irish | 96.6 /100 | #81 | Exceptional 11.3% |
| Egyptians | 96.5 /100 | #82 | Exceptional 11.3% |
| Immigrants | Sweden | 96.3 /100 | #83 | Exceptional 11.3% |
| English | 96.3 /100 | #84 | Exceptional 11.3% |
| Immigrants | England | 96.2 /100 | #85 | Exceptional 11.4% |
| Jordanians | 96.0 /100 | #86 | Exceptional 11.4% |
| Northern Europeans | 96.0 /100 | #87 | Exceptional 11.4% |
| Belgians | 95.8 /100 | #88 | Exceptional 11.4% |
| Czechoslovakians | 95.7 /100 | #89 | Exceptional 11.4% |
| Immigrants | Denmark | 95.5 /100 | #90 | Exceptional 11.4% |
Demographics Similar to Trinidadians and Tobagonians by Poverty
In terms of poverty, the demographic groups most similar to Trinidadians and Tobagonians are Ottawa (14.3%, a difference of 0.010%), Mexican American Indian (14.3%, a difference of 0.040%), Immigrants from Ecuador (14.3%, a difference of 0.060%), Immigrants from El Salvador (14.3%, a difference of 0.16%), and Immigrants from Nicaragua (14.3%, a difference of 0.28%).
| Demographics | Rating | Rank | Poverty |
| Cree | 0.2 /100 | #250 | Tragic 14.2% |
| Immigrants | Burma/Myanmar | 0.2 /100 | #251 | Tragic 14.2% |
| Spanish American Indians | 0.2 /100 | #252 | Tragic 14.2% |
| Immigrants | Trinidad and Tobago | 0.2 /100 | #253 | Tragic 14.2% |
| Immigrants | El Salvador | 0.1 /100 | #254 | Tragic 14.3% |
| Immigrants | Ecuador | 0.1 /100 | #255 | Tragic 14.3% |
| Mexican American Indians | 0.1 /100 | #256 | Tragic 14.3% |
| Trinidadians and Tobagonians | 0.1 /100 | #257 | Tragic 14.3% |
| Ottawa | 0.1 /100 | #258 | Tragic 14.3% |
| Immigrants | Nicaragua | 0.1 /100 | #259 | Tragic 14.3% |
| Cape Verdeans | 0.1 /100 | #260 | Tragic 14.4% |
| Cherokee | 0.1 /100 | #261 | Tragic 14.4% |
| Immigrants | Liberia | 0.1 /100 | #262 | Tragic 14.4% |
| Jamaicans | 0.1 /100 | #263 | Tragic 14.4% |
| Immigrants | Jamaica | 0.1 /100 | #264 | Tragic 14.4% |