Immigrants from Morocco vs Trinidadian and Tobagonian Unemployment Among Seniors over 65 years
COMPARE
Immigrants from Morocco
Trinidadian and Tobagonian
Unemployment Among Seniors over 65 years
Unemployment Among Seniors over 65 years Comparison
Immigrants from Morocco
Trinidadians and Tobagonians
5.4%
UNEMPLOYMENT AMONG SENIORS OVER 65 YEARS
0.1/ 100
METRIC RATING
270th/ 347
METRIC RANK
5.4%
UNEMPLOYMENT AMONG SENIORS OVER 65 YEARS
0.6/ 100
METRIC RATING
252nd/ 347
METRIC RANK
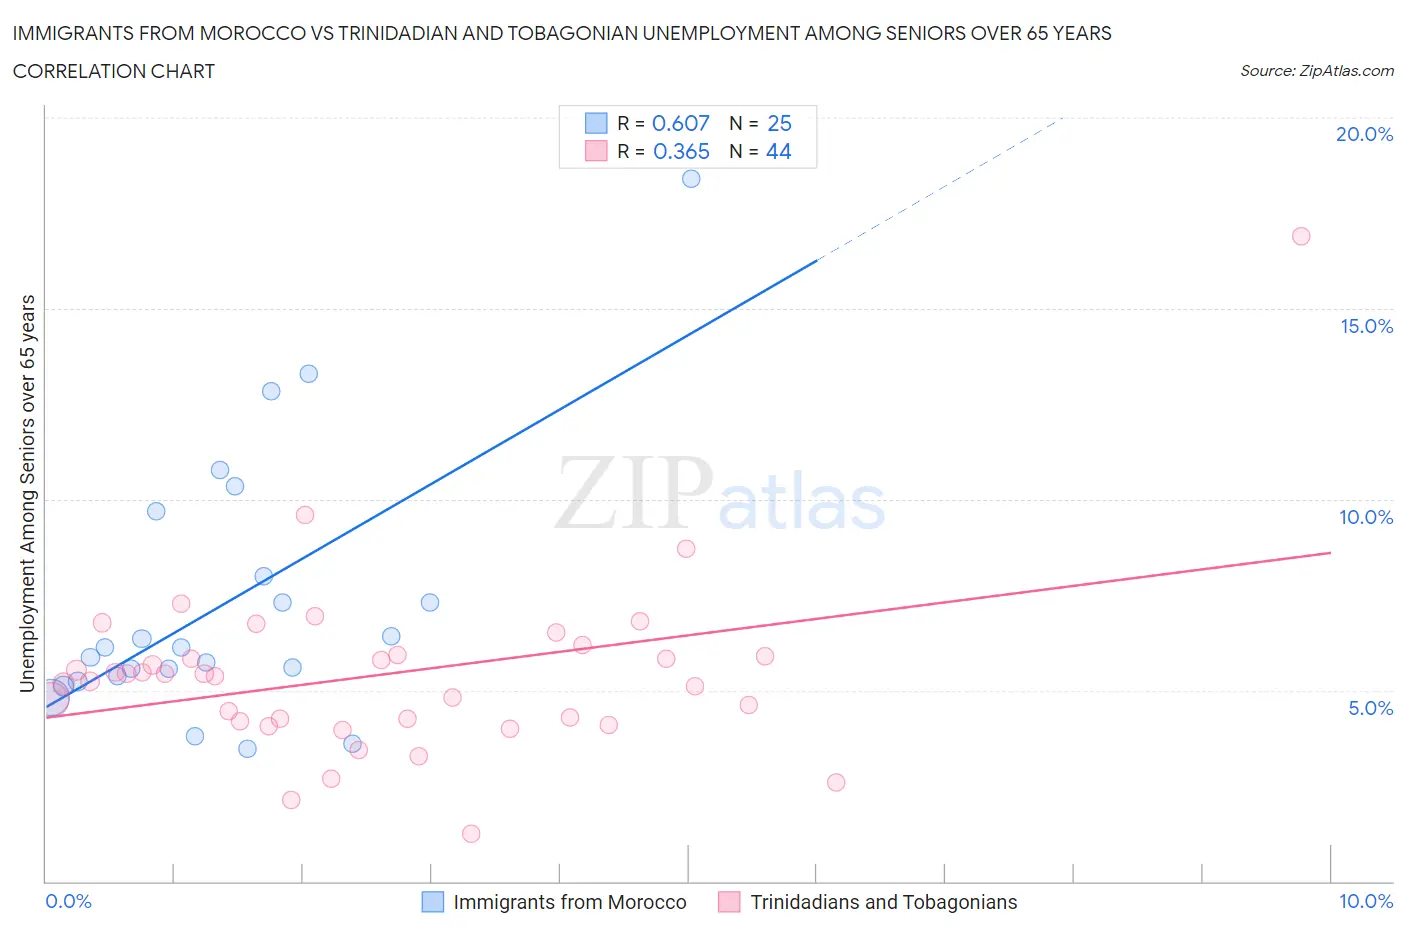
Immigrants from Morocco vs Trinidadian and Tobagonian Unemployment Among Seniors over 65 years Correlation Chart
The statistical analysis conducted on geographies consisting of 171,708,146 people shows a significant positive correlation between the proportion of Immigrants from Morocco and unemployment rate amomg seniors over the age of 65 in the United States with a correlation coefficient (R) of 0.607 and weighted average of 5.4%. Similarly, the statistical analysis conducted on geographies consisting of 207,503,082 people shows a mild positive correlation between the proportion of Trinidadians and Tobagonians and unemployment rate amomg seniors over the age of 65 in the United States with a correlation coefficient (R) of 0.365 and weighted average of 5.4%, a difference of 1.3%.
Unemployment Among Seniors over 65 years Correlation Summary
| Measurement | Immigrants from Morocco | Trinidadian and Tobagonian |
| Minimum | 3.5% | 1.2% |
| Maximum | 18.4% | 16.9% |
| Range | 14.9% | 15.7% |
| Mean | 7.3% | 5.4% |
| Median | 6.1% | 5.4% |
| Interquartile 25% (IQ1) | 5.3% | 4.2% |
| Interquartile 75% (IQ3) | 8.8% | 5.9% |
| Interquartile Range (IQR) | 3.5% | 1.7% |
| Standard Deviation (Sample) | 3.5% | 2.4% |
| Standard Deviation (Population) | 3.4% | 2.3% |
Demographics Similar to Immigrants from Morocco and Trinidadians and Tobagonians by Unemployment Among Seniors over 65 years
In terms of unemployment among seniors over 65 years, the demographic groups most similar to Immigrants from Morocco are Cypriot (5.4%, a difference of 0.010%), Immigrants from Southern Europe (5.4%, a difference of 0.070%), Hawaiian (5.4%, a difference of 0.21%), Pennsylvania German (5.4%, a difference of 0.31%), and Chippewa (5.4%, a difference of 0.31%). Similarly, the demographic groups most similar to Trinidadians and Tobagonians are Immigrants from Sierra Leone (5.4%, a difference of 0.030%), West Indian (5.4%, a difference of 0.070%), Paraguayan (5.4%, a difference of 0.090%), Immigrants from Peru (5.4%, a difference of 0.090%), and Moroccan (5.4%, a difference of 0.12%).
| Demographics | Rating | Rank | Unemployment Among Seniors over 65 years |
| West Indians | 0.6 /100 | #251 | Tragic 5.4% |
| Trinidadians and Tobagonians | 0.6 /100 | #252 | Tragic 5.4% |
| Immigrants | Sierra Leone | 0.6 /100 | #253 | Tragic 5.4% |
| Paraguayans | 0.5 /100 | #254 | Tragic 5.4% |
| Immigrants | Peru | 0.5 /100 | #255 | Tragic 5.4% |
| Moroccans | 0.5 /100 | #256 | Tragic 5.4% |
| Immigrants | Micronesia | 0.4 /100 | #257 | Tragic 5.4% |
| Sierra Leoneans | 0.4 /100 | #258 | Tragic 5.4% |
| Immigrants | Ghana | 0.4 /100 | #259 | Tragic 5.4% |
| Native Hawaiians | 0.3 /100 | #260 | Tragic 5.4% |
| Spanish American Indians | 0.2 /100 | #261 | Tragic 5.4% |
| Immigrants | Grenada | 0.2 /100 | #262 | Tragic 5.4% |
| South Americans | 0.2 /100 | #263 | Tragic 5.4% |
| Central American Indians | 0.2 /100 | #264 | Tragic 5.4% |
| Immigrants | Colombia | 0.2 /100 | #265 | Tragic 5.4% |
| Pennsylvania Germans | 0.2 /100 | #266 | Tragic 5.4% |
| Chippewa | 0.2 /100 | #267 | Tragic 5.4% |
| Hawaiians | 0.1 /100 | #268 | Tragic 5.4% |
| Immigrants | Southern Europe | 0.1 /100 | #269 | Tragic 5.4% |
| Immigrants | Morocco | 0.1 /100 | #270 | Tragic 5.4% |
| Cypriots | 0.1 /100 | #271 | Tragic 5.4% |