Immigrants from Moldova vs Immigrants from Northern Africa Poverty
COMPARE
Immigrants from Moldova
Immigrants from Northern Africa
Poverty
Poverty Comparison
Immigrants from Moldova
Immigrants from Northern Africa
10.9%
POVERTY
99.1/ 100
METRIC RATING
44th/ 347
METRIC RANK
12.1%
POVERTY
63.9/ 100
METRIC RATING
153rd/ 347
METRIC RANK
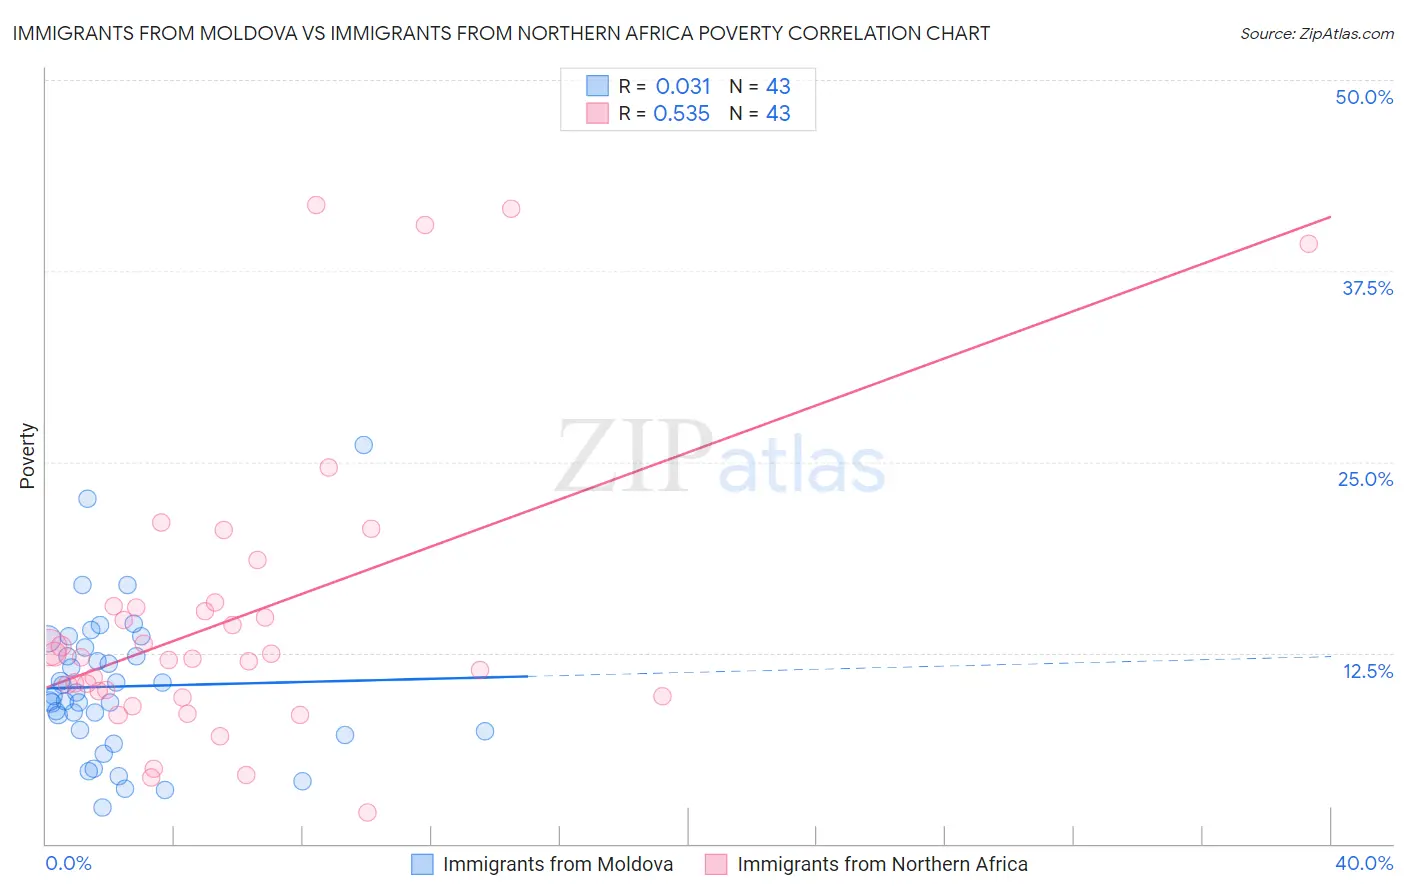
Immigrants from Moldova vs Immigrants from Northern Africa Poverty Correlation Chart
The statistical analysis conducted on geographies consisting of 124,373,713 people shows no correlation between the proportion of Immigrants from Moldova and poverty level in the United States with a correlation coefficient (R) of 0.031 and weighted average of 10.9%. Similarly, the statistical analysis conducted on geographies consisting of 321,083,252 people shows a substantial positive correlation between the proportion of Immigrants from Northern Africa and poverty level in the United States with a correlation coefficient (R) of 0.535 and weighted average of 12.1%, a difference of 11.4%.
Poverty Correlation Summary
| Measurement | Immigrants from Moldova | Immigrants from Northern Africa |
| Minimum | 2.4% | 2.1% |
| Maximum | 26.1% | 41.8% |
| Range | 23.7% | 39.7% |
| Mean | 10.3% | 14.8% |
| Median | 9.7% | 12.2% |
| Interquartile 25% (IQ1) | 7.4% | 9.7% |
| Interquartile 75% (IQ3) | 12.9% | 15.6% |
| Interquartile Range (IQR) | 5.5% | 5.9% |
| Standard Deviation (Sample) | 4.8% | 9.6% |
| Standard Deviation (Population) | 4.7% | 9.5% |
Similar Demographics by Poverty
Demographics Similar to Immigrants from Moldova by Poverty
In terms of poverty, the demographic groups most similar to Immigrants from Moldova are Immigrants from Singapore (10.9%, a difference of 0.14%), Korean (10.9%, a difference of 0.19%), Immigrants from Iran (10.9%, a difference of 0.41%), Russian (10.9%, a difference of 0.50%), and Turkish (11.0%, a difference of 0.51%).
| Demographics | Rating | Rank | Poverty |
| Immigrants | Greece | 99.3 /100 | #37 | Exceptional 10.8% |
| Czechs | 99.3 /100 | #38 | Exceptional 10.8% |
| Immigrants | Pakistan | 99.3 /100 | #39 | Exceptional 10.8% |
| Russians | 99.3 /100 | #40 | Exceptional 10.9% |
| Immigrants | Iran | 99.2 /100 | #41 | Exceptional 10.9% |
| Koreans | 99.2 /100 | #42 | Exceptional 10.9% |
| Immigrants | Singapore | 99.2 /100 | #43 | Exceptional 10.9% |
| Immigrants | Moldova | 99.1 /100 | #44 | Exceptional 10.9% |
| Turks | 98.9 /100 | #45 | Exceptional 11.0% |
| Immigrants | Czechoslovakia | 98.9 /100 | #46 | Exceptional 11.0% |
| Immigrants | Romania | 98.9 /100 | #47 | Exceptional 11.0% |
| Slovenes | 98.9 /100 | #48 | Exceptional 11.0% |
| Immigrants | Japan | 98.9 /100 | #49 | Exceptional 11.0% |
| Asians | 98.9 /100 | #50 | Exceptional 11.0% |
| Immigrants | Croatia | 98.7 /100 | #51 | Exceptional 11.0% |
Demographics Similar to Immigrants from Northern Africa by Poverty
In terms of poverty, the demographic groups most similar to Immigrants from Northern Africa are Guamanian/Chamorro (12.1%, a difference of 0.010%), Hungarian (12.2%, a difference of 0.030%), Scotch-Irish (12.2%, a difference of 0.15%), Costa Rican (12.2%, a difference of 0.18%), and Taiwanese (12.2%, a difference of 0.22%).
| Demographics | Rating | Rank | Poverty |
| Afghans | 74.9 /100 | #146 | Good 12.0% |
| Immigrants | Bosnia and Herzegovina | 73.7 /100 | #147 | Good 12.0% |
| Immigrants | Germany | 72.7 /100 | #148 | Good 12.0% |
| Immigrants | Malaysia | 72.7 /100 | #149 | Good 12.0% |
| Immigrants | Kazakhstan | 72.3 /100 | #150 | Good 12.0% |
| Samoans | 71.9 /100 | #151 | Good 12.0% |
| Armenians | 67.6 /100 | #152 | Good 12.1% |
| Immigrants | Northern Africa | 63.9 /100 | #153 | Good 12.1% |
| Guamanians/Chamorros | 63.9 /100 | #154 | Good 12.1% |
| Hungarians | 63.6 /100 | #155 | Good 12.2% |
| Scotch-Irish | 62.6 /100 | #156 | Good 12.2% |
| Costa Ricans | 62.2 /100 | #157 | Good 12.2% |
| Taiwanese | 61.8 /100 | #158 | Good 12.2% |
| Pennsylvania Germans | 60.8 /100 | #159 | Good 12.2% |
| Immigrants | Nepal | 60.4 /100 | #160 | Good 12.2% |