Immigrants from Greece vs Immigrants from Northern Africa Poverty
COMPARE
Immigrants from Greece
Immigrants from Northern Africa
Poverty
Poverty Comparison
Immigrants from Greece
Immigrants from Northern Africa
10.8%
POVERTY
99.3/ 100
METRIC RATING
37th/ 347
METRIC RANK
12.1%
POVERTY
63.9/ 100
METRIC RATING
153rd/ 347
METRIC RANK
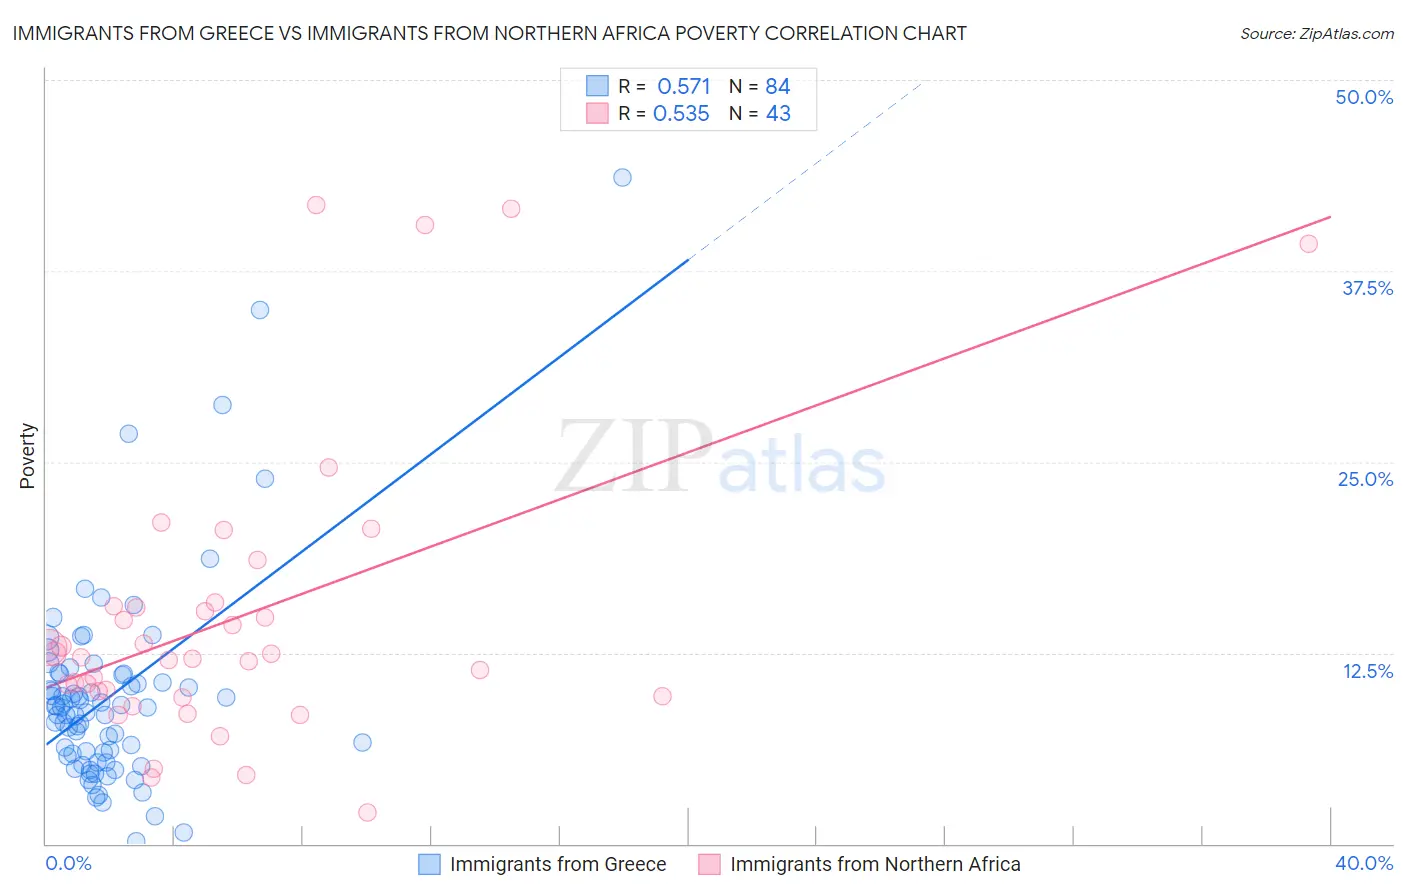
Immigrants from Greece vs Immigrants from Northern Africa Poverty Correlation Chart
The statistical analysis conducted on geographies consisting of 216,856,400 people shows a substantial positive correlation between the proportion of Immigrants from Greece and poverty level in the United States with a correlation coefficient (R) of 0.571 and weighted average of 10.8%. Similarly, the statistical analysis conducted on geographies consisting of 321,083,252 people shows a substantial positive correlation between the proportion of Immigrants from Northern Africa and poverty level in the United States with a correlation coefficient (R) of 0.535 and weighted average of 12.1%, a difference of 12.1%.
Poverty Correlation Summary
| Measurement | Immigrants from Greece | Immigrants from Northern Africa |
| Minimum | 0.19% | 2.1% |
| Maximum | 43.6% | 41.8% |
| Range | 43.4% | 39.7% |
| Mean | 9.7% | 14.8% |
| Median | 8.9% | 12.2% |
| Interquartile 25% (IQ1) | 5.8% | 9.7% |
| Interquartile 75% (IQ3) | 11.1% | 15.6% |
| Interquartile Range (IQR) | 5.3% | 5.9% |
| Standard Deviation (Sample) | 6.8% | 9.6% |
| Standard Deviation (Population) | 6.8% | 9.5% |
Similar Demographics by Poverty
Demographics Similar to Immigrants from Greece by Poverty
In terms of poverty, the demographic groups most similar to Immigrants from Greece are Czech (10.8%, a difference of 0.050%), Cypriot (10.8%, a difference of 0.10%), Immigrants from Pakistan (10.8%, a difference of 0.13%), Tongan (10.8%, a difference of 0.17%), and Russian (10.9%, a difference of 0.18%).
| Demographics | Rating | Rank | Poverty |
| Danes | 99.5 /100 | #30 | Exceptional 10.7% |
| Poles | 99.5 /100 | #31 | Exceptional 10.7% |
| Iranians | 99.5 /100 | #32 | Exceptional 10.7% |
| Macedonians | 99.4 /100 | #33 | Exceptional 10.8% |
| Immigrants | Poland | 99.4 /100 | #34 | Exceptional 10.8% |
| Tongans | 99.4 /100 | #35 | Exceptional 10.8% |
| Cypriots | 99.3 /100 | #36 | Exceptional 10.8% |
| Immigrants | Greece | 99.3 /100 | #37 | Exceptional 10.8% |
| Czechs | 99.3 /100 | #38 | Exceptional 10.8% |
| Immigrants | Pakistan | 99.3 /100 | #39 | Exceptional 10.8% |
| Russians | 99.3 /100 | #40 | Exceptional 10.9% |
| Immigrants | Iran | 99.2 /100 | #41 | Exceptional 10.9% |
| Koreans | 99.2 /100 | #42 | Exceptional 10.9% |
| Immigrants | Singapore | 99.2 /100 | #43 | Exceptional 10.9% |
| Immigrants | Moldova | 99.1 /100 | #44 | Exceptional 10.9% |
Demographics Similar to Immigrants from Northern Africa by Poverty
In terms of poverty, the demographic groups most similar to Immigrants from Northern Africa are Guamanian/Chamorro (12.1%, a difference of 0.010%), Hungarian (12.2%, a difference of 0.030%), Scotch-Irish (12.2%, a difference of 0.15%), Costa Rican (12.2%, a difference of 0.18%), and Taiwanese (12.2%, a difference of 0.22%).
| Demographics | Rating | Rank | Poverty |
| Afghans | 74.9 /100 | #146 | Good 12.0% |
| Immigrants | Bosnia and Herzegovina | 73.7 /100 | #147 | Good 12.0% |
| Immigrants | Germany | 72.7 /100 | #148 | Good 12.0% |
| Immigrants | Malaysia | 72.7 /100 | #149 | Good 12.0% |
| Immigrants | Kazakhstan | 72.3 /100 | #150 | Good 12.0% |
| Samoans | 71.9 /100 | #151 | Good 12.0% |
| Armenians | 67.6 /100 | #152 | Good 12.1% |
| Immigrants | Northern Africa | 63.9 /100 | #153 | Good 12.1% |
| Guamanians/Chamorros | 63.9 /100 | #154 | Good 12.1% |
| Hungarians | 63.6 /100 | #155 | Good 12.2% |
| Scotch-Irish | 62.6 /100 | #156 | Good 12.2% |
| Costa Ricans | 62.2 /100 | #157 | Good 12.2% |
| Taiwanese | 61.8 /100 | #158 | Good 12.2% |
| Pennsylvania Germans | 60.8 /100 | #159 | Good 12.2% |
| Immigrants | Nepal | 60.4 /100 | #160 | Good 12.2% |