Immigrants from Western Europe vs Immigrants from Northern Africa Poverty
COMPARE
Immigrants from Western Europe
Immigrants from Northern Africa
Poverty
Poverty Comparison
Immigrants from Western Europe
Immigrants from Northern Africa
11.8%
POVERTY
85.2/ 100
METRIC RATING
133rd/ 347
METRIC RANK
12.1%
POVERTY
63.9/ 100
METRIC RATING
153rd/ 347
METRIC RANK
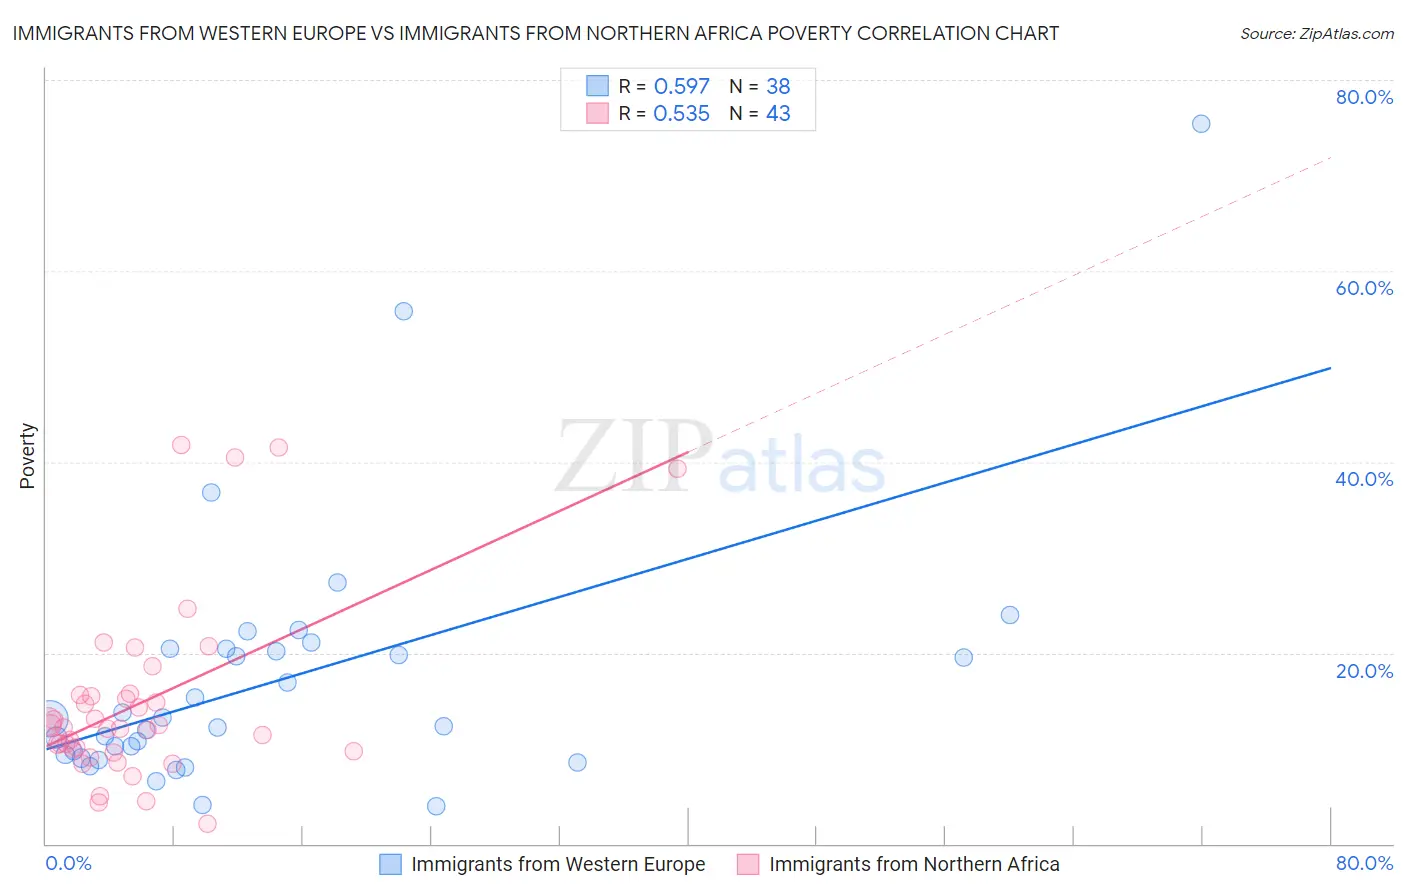
Immigrants from Western Europe vs Immigrants from Northern Africa Poverty Correlation Chart
The statistical analysis conducted on geographies consisting of 493,769,922 people shows a substantial positive correlation between the proportion of Immigrants from Western Europe and poverty level in the United States with a correlation coefficient (R) of 0.597 and weighted average of 11.8%. Similarly, the statistical analysis conducted on geographies consisting of 321,083,252 people shows a substantial positive correlation between the proportion of Immigrants from Northern Africa and poverty level in the United States with a correlation coefficient (R) of 0.535 and weighted average of 12.1%, a difference of 3.0%.
Poverty Correlation Summary
| Measurement | Immigrants from Western Europe | Immigrants from Northern Africa |
| Minimum | 3.9% | 2.1% |
| Maximum | 75.4% | 41.8% |
| Range | 71.5% | 39.7% |
| Mean | 17.1% | 14.8% |
| Median | 12.7% | 12.2% |
| Interquartile 25% (IQ1) | 9.3% | 9.7% |
| Interquartile 75% (IQ3) | 20.4% | 15.6% |
| Interquartile Range (IQR) | 11.1% | 5.9% |
| Standard Deviation (Sample) | 13.7% | 9.6% |
| Standard Deviation (Population) | 13.5% | 9.5% |
Demographics Similar to Immigrants from Western Europe and Immigrants from Northern Africa by Poverty
In terms of poverty, the demographic groups most similar to Immigrants from Western Europe are Yugoslavian (11.8%, a difference of 0.010%), Immigrants from Vietnam (11.8%, a difference of 0.020%), Chilean (11.8%, a difference of 0.21%), Immigrants from Switzerland (11.8%, a difference of 0.43%), and Immigrants from Jordan (11.9%, a difference of 0.54%). Similarly, the demographic groups most similar to Immigrants from Northern Africa are Armenian (12.1%, a difference of 0.41%), Samoan (12.0%, a difference of 0.91%), Immigrants from Kazakhstan (12.0%, a difference of 0.95%), Immigrants from Germany (12.0%, a difference of 1.0%), and Immigrants from Malaysia (12.0%, a difference of 1.0%).
| Demographics | Rating | Rank | Poverty |
| Immigrants | Western Europe | 85.2 /100 | #133 | Excellent 11.8% |
| Yugoslavians | 85.2 /100 | #134 | Excellent 11.8% |
| Immigrants | Vietnam | 85.2 /100 | #135 | Excellent 11.8% |
| Chileans | 84.2 /100 | #136 | Excellent 11.8% |
| Immigrants | Switzerland | 83.0 /100 | #137 | Excellent 11.8% |
| Immigrants | Jordan | 82.4 /100 | #138 | Excellent 11.9% |
| Pakistanis | 82.2 /100 | #139 | Excellent 11.9% |
| Immigrants | Peru | 81.1 /100 | #140 | Excellent 11.9% |
| Immigrants | France | 80.5 /100 | #141 | Excellent 11.9% |
| Basques | 80.4 /100 | #142 | Excellent 11.9% |
| Brazilians | 79.7 /100 | #143 | Good 11.9% |
| Icelanders | 77.9 /100 | #144 | Good 11.9% |
| Syrians | 75.1 /100 | #145 | Good 12.0% |
| Afghans | 74.9 /100 | #146 | Good 12.0% |
| Immigrants | Bosnia and Herzegovina | 73.7 /100 | #147 | Good 12.0% |
| Immigrants | Germany | 72.7 /100 | #148 | Good 12.0% |
| Immigrants | Malaysia | 72.7 /100 | #149 | Good 12.0% |
| Immigrants | Kazakhstan | 72.3 /100 | #150 | Good 12.0% |
| Samoans | 71.9 /100 | #151 | Good 12.0% |
| Armenians | 67.6 /100 | #152 | Good 12.1% |
| Immigrants | Northern Africa | 63.9 /100 | #153 | Good 12.1% |