Immigrants from Sri Lanka vs Immigrants from Northern Africa Poverty
COMPARE
Immigrants from Sri Lanka
Immigrants from Northern Africa
Poverty
Poverty Comparison
Immigrants from Sri Lanka
Immigrants from Northern Africa
11.2%
POVERTY
97.9/ 100
METRIC RATING
60th/ 347
METRIC RANK
12.1%
POVERTY
63.9/ 100
METRIC RATING
153rd/ 347
METRIC RANK
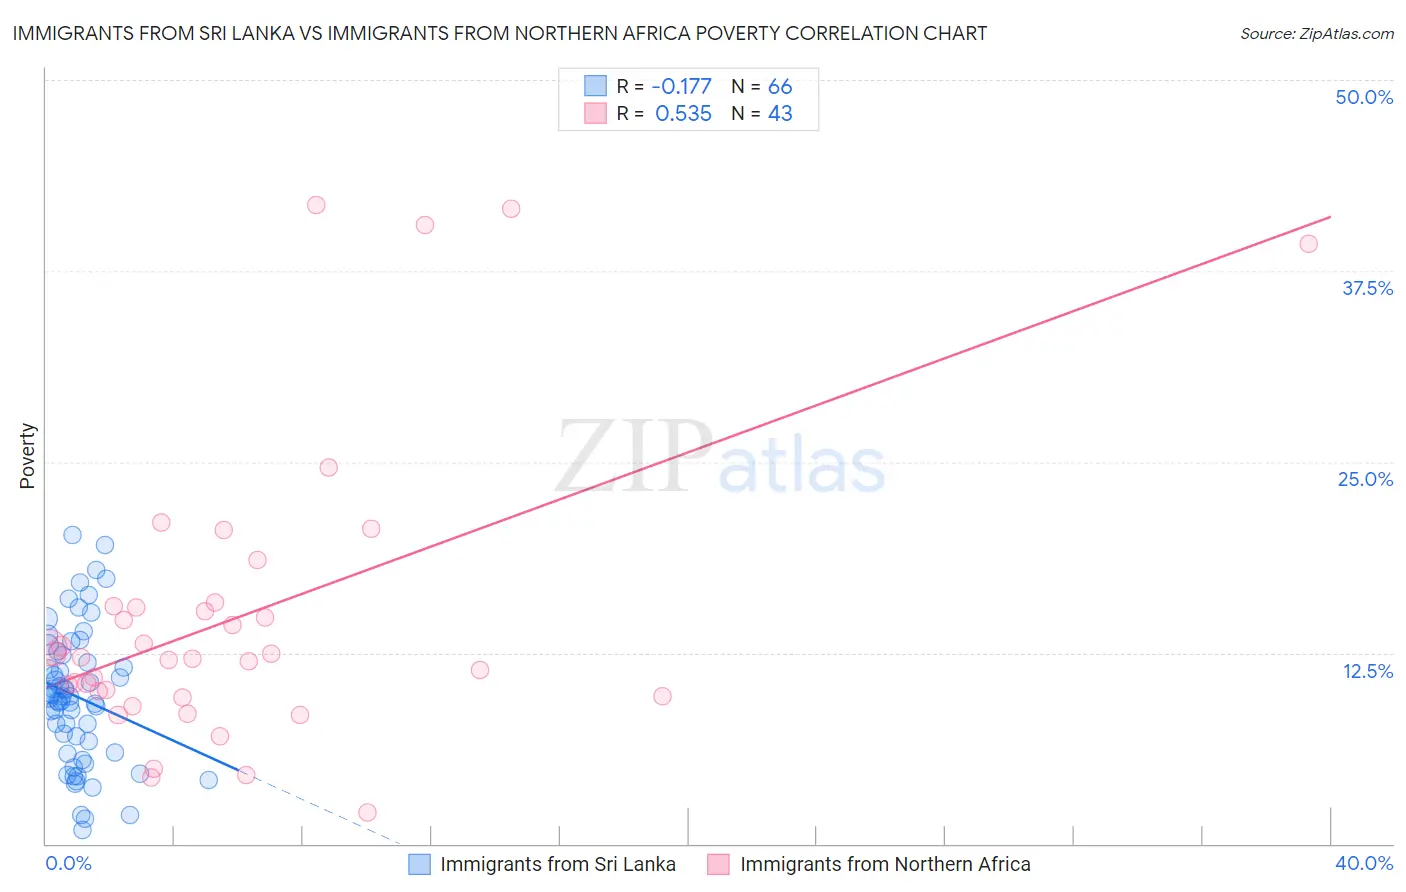
Immigrants from Sri Lanka vs Immigrants from Northern Africa Poverty Correlation Chart
The statistical analysis conducted on geographies consisting of 149,683,532 people shows a poor negative correlation between the proportion of Immigrants from Sri Lanka and poverty level in the United States with a correlation coefficient (R) of -0.177 and weighted average of 11.2%. Similarly, the statistical analysis conducted on geographies consisting of 321,083,252 people shows a substantial positive correlation between the proportion of Immigrants from Northern Africa and poverty level in the United States with a correlation coefficient (R) of 0.535 and weighted average of 12.1%, a difference of 8.7%.
Poverty Correlation Summary
| Measurement | Immigrants from Sri Lanka | Immigrants from Northern Africa |
| Minimum | 0.89% | 2.1% |
| Maximum | 20.2% | 41.8% |
| Range | 19.3% | 39.7% |
| Mean | 9.6% | 14.8% |
| Median | 9.6% | 12.2% |
| Interquartile 25% (IQ1) | 6.0% | 9.7% |
| Interquartile 75% (IQ3) | 12.4% | 15.6% |
| Interquartile Range (IQR) | 6.4% | 5.9% |
| Standard Deviation (Sample) | 4.5% | 9.6% |
| Standard Deviation (Population) | 4.4% | 9.5% |
Similar Demographics by Poverty
Demographics Similar to Immigrants from Sri Lanka by Poverty
In terms of poverty, the demographic groups most similar to Immigrants from Sri Lanka are Immigrants from Italy (11.2%, a difference of 0.060%), Austrian (11.2%, a difference of 0.10%), Ukrainian (11.2%, a difference of 0.10%), Immigrants from Europe (11.2%, a difference of 0.16%), and German (11.1%, a difference of 0.31%).
| Demographics | Rating | Rank | Poverty |
| Immigrants | Austria | 98.6 /100 | #53 | Exceptional 11.1% |
| Immigrants | Bulgaria | 98.5 /100 | #54 | Exceptional 11.1% |
| Immigrants | Serbia | 98.5 /100 | #55 | Exceptional 11.1% |
| Estonians | 98.2 /100 | #56 | Exceptional 11.1% |
| Scandinavians | 98.2 /100 | #57 | Exceptional 11.1% |
| Germans | 98.1 /100 | #58 | Exceptional 11.1% |
| Immigrants | Europe | 98.0 /100 | #59 | Exceptional 11.2% |
| Immigrants | Sri Lanka | 97.9 /100 | #60 | Exceptional 11.2% |
| Immigrants | Italy | 97.9 /100 | #61 | Exceptional 11.2% |
| Austrians | 97.8 /100 | #62 | Exceptional 11.2% |
| Ukrainians | 97.8 /100 | #63 | Exceptional 11.2% |
| Swiss | 97.7 /100 | #64 | Exceptional 11.2% |
| Immigrants | Asia | 97.5 /100 | #65 | Exceptional 11.2% |
| Immigrants | Netherlands | 97.5 /100 | #66 | Exceptional 11.2% |
| Immigrants | Australia | 97.4 /100 | #67 | Exceptional 11.2% |
Demographics Similar to Immigrants from Northern Africa by Poverty
In terms of poverty, the demographic groups most similar to Immigrants from Northern Africa are Guamanian/Chamorro (12.1%, a difference of 0.010%), Hungarian (12.2%, a difference of 0.030%), Scotch-Irish (12.2%, a difference of 0.15%), Costa Rican (12.2%, a difference of 0.18%), and Taiwanese (12.2%, a difference of 0.22%).
| Demographics | Rating | Rank | Poverty |
| Afghans | 74.9 /100 | #146 | Good 12.0% |
| Immigrants | Bosnia and Herzegovina | 73.7 /100 | #147 | Good 12.0% |
| Immigrants | Germany | 72.7 /100 | #148 | Good 12.0% |
| Immigrants | Malaysia | 72.7 /100 | #149 | Good 12.0% |
| Immigrants | Kazakhstan | 72.3 /100 | #150 | Good 12.0% |
| Samoans | 71.9 /100 | #151 | Good 12.0% |
| Armenians | 67.6 /100 | #152 | Good 12.1% |
| Immigrants | Northern Africa | 63.9 /100 | #153 | Good 12.1% |
| Guamanians/Chamorros | 63.9 /100 | #154 | Good 12.1% |
| Hungarians | 63.6 /100 | #155 | Good 12.2% |
| Scotch-Irish | 62.6 /100 | #156 | Good 12.2% |
| Costa Ricans | 62.2 /100 | #157 | Good 12.2% |
| Taiwanese | 61.8 /100 | #158 | Good 12.2% |
| Pennsylvania Germans | 60.8 /100 | #159 | Good 12.2% |
| Immigrants | Nepal | 60.4 /100 | #160 | Good 12.2% |