Carpatho Rusyn vs Pueblo Poverty
COMPARE
Carpatho Rusyn
Pueblo
Poverty
Poverty Comparison
Carpatho Rusyns
Pueblo
11.3%
POVERTY
97.2/ 100
METRIC RATING
74th/ 347
METRIC RANK
19.4%
POVERTY
0.0/ 100
METRIC RATING
336th/ 347
METRIC RANK
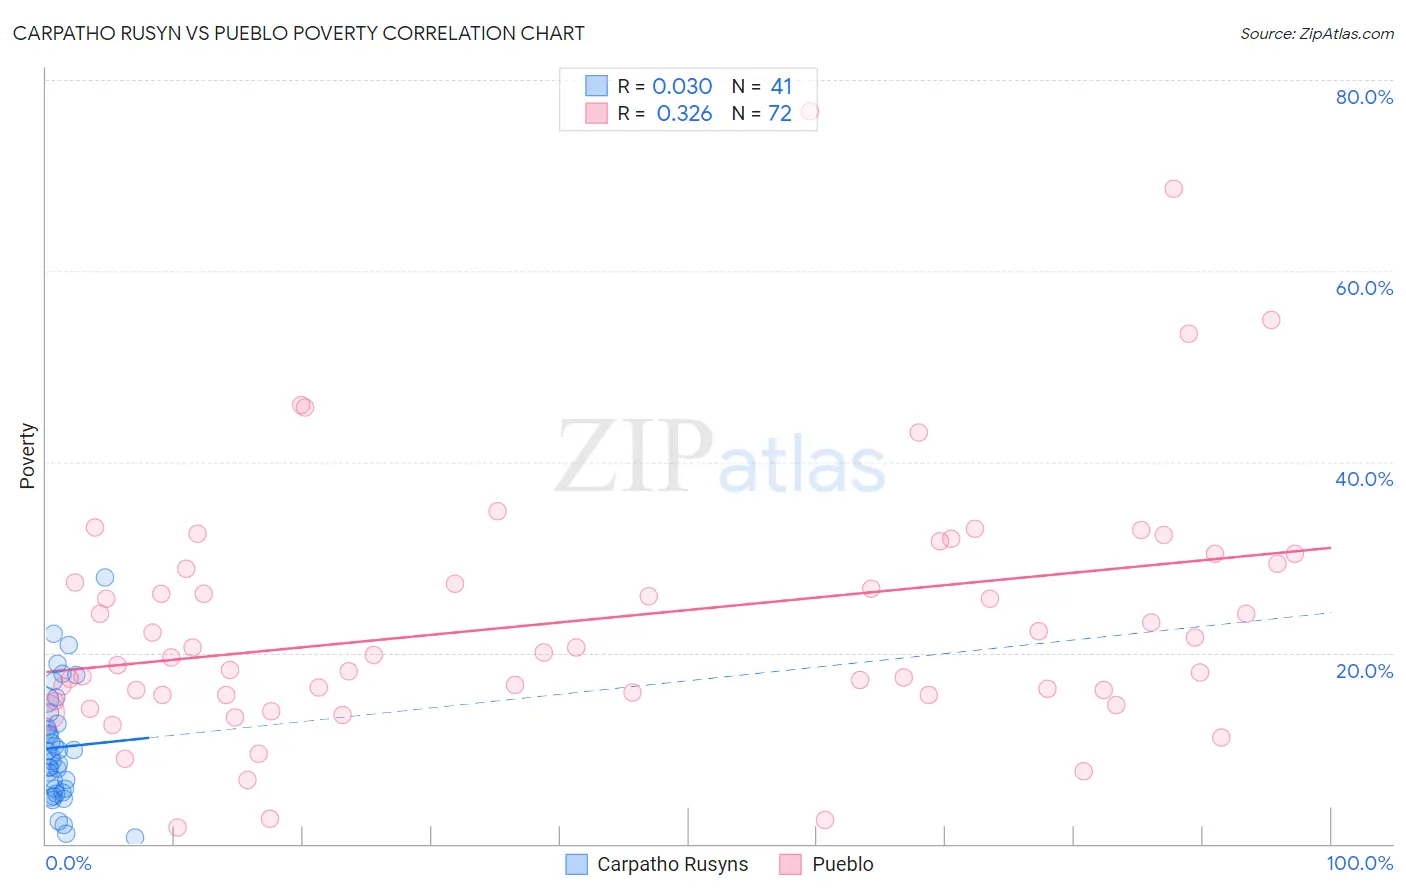
Carpatho Rusyn vs Pueblo Poverty Correlation Chart
The statistical analysis conducted on geographies consisting of 58,869,628 people shows no correlation between the proportion of Carpatho Rusyns and poverty level in the United States with a correlation coefficient (R) of 0.030 and weighted average of 11.3%. Similarly, the statistical analysis conducted on geographies consisting of 120,076,911 people shows a mild positive correlation between the proportion of Pueblo and poverty level in the United States with a correlation coefficient (R) of 0.326 and weighted average of 19.4%, a difference of 72.4%.
Poverty Correlation Summary
| Measurement | Carpatho Rusyn | Pueblo |
| Minimum | 0.68% | 1.7% |
| Maximum | 27.9% | 76.8% |
| Range | 27.2% | 75.1% |
| Mean | 10.1% | 23.4% |
| Median | 9.2% | 19.9% |
| Interquartile 25% (IQ1) | 5.6% | 15.6% |
| Interquartile 75% (IQ3) | 13.1% | 29.0% |
| Interquartile Range (IQR) | 7.6% | 13.4% |
| Standard Deviation (Sample) | 6.0% | 13.6% |
| Standard Deviation (Population) | 5.9% | 13.5% |
Similar Demographics by Poverty
Demographics Similar to Carpatho Rusyns by Poverty
In terms of poverty, the demographic groups most similar to Carpatho Rusyns are European (11.3%, a difference of 0.050%), Immigrants from Belgium (11.3%, a difference of 0.050%), Zimbabwean (11.3%, a difference of 0.070%), Immigrants from Canada (11.3%, a difference of 0.090%), and Serbian (11.2%, a difference of 0.18%).
| Demographics | Rating | Rank | Poverty |
| Immigrants | Australia | 97.4 /100 | #67 | Exceptional 11.2% |
| Slovaks | 97.4 /100 | #68 | Exceptional 11.2% |
| Serbians | 97.4 /100 | #69 | Exceptional 11.2% |
| Immigrants | Canada | 97.3 /100 | #70 | Exceptional 11.3% |
| Zimbabweans | 97.3 /100 | #71 | Exceptional 11.3% |
| Europeans | 97.2 /100 | #72 | Exceptional 11.3% |
| Immigrants | Belgium | 97.2 /100 | #73 | Exceptional 11.3% |
| Carpatho Rusyns | 97.2 /100 | #74 | Exceptional 11.3% |
| Immigrants | Eastern Europe | 97.0 /100 | #75 | Exceptional 11.3% |
| Immigrants | North America | 96.8 /100 | #76 | Exceptional 11.3% |
| Immigrants | Eastern Asia | 96.7 /100 | #77 | Exceptional 11.3% |
| Dutch | 96.7 /100 | #78 | Exceptional 11.3% |
| Cambodians | 96.7 /100 | #79 | Exceptional 11.3% |
| Indians (Asian) | 96.6 /100 | #80 | Exceptional 11.3% |
| Irish | 96.6 /100 | #81 | Exceptional 11.3% |
Demographics Similar to Pueblo by Poverty
In terms of poverty, the demographic groups most similar to Pueblo are Sioux (19.8%, a difference of 1.9%), Cheyenne (18.9%, a difference of 2.5%), Yuman (20.2%, a difference of 4.1%), Houma (18.4%, a difference of 5.4%), and Apache (18.4%, a difference of 5.4%).
| Demographics | Rating | Rank | Poverty |
| Blacks/African Americans | 0.0 /100 | #329 | Tragic 17.3% |
| Dominicans | 0.0 /100 | #330 | Tragic 17.6% |
| Immigrants | Dominican Republic | 0.0 /100 | #331 | Tragic 17.8% |
| Natives/Alaskans | 0.0 /100 | #332 | Tragic 18.1% |
| Houma | 0.0 /100 | #333 | Tragic 18.4% |
| Apache | 0.0 /100 | #334 | Tragic 18.4% |
| Cheyenne | 0.0 /100 | #335 | Tragic 18.9% |
| Pueblo | 0.0 /100 | #336 | Tragic 19.4% |
| Sioux | 0.0 /100 | #337 | Tragic 19.8% |
| Yuman | 0.0 /100 | #338 | Tragic 20.2% |
| Crow | 0.0 /100 | #339 | Tragic 20.7% |
| Yup'ik | 0.0 /100 | #340 | Tragic 20.8% |
| Hopi | 0.0 /100 | #341 | Tragic 20.8% |
| Immigrants | Yemen | 0.0 /100 | #342 | Tragic 21.5% |
| Pima | 0.0 /100 | #343 | Tragic 21.9% |