Haitian vs Pueblo Poverty
COMPARE
Haitian
Pueblo
Poverty
Poverty Comparison
Haitians
Pueblo
14.9%
POVERTY
0.0/ 100
METRIC RATING
280th/ 347
METRIC RANK
19.4%
POVERTY
0.0/ 100
METRIC RATING
336th/ 347
METRIC RANK
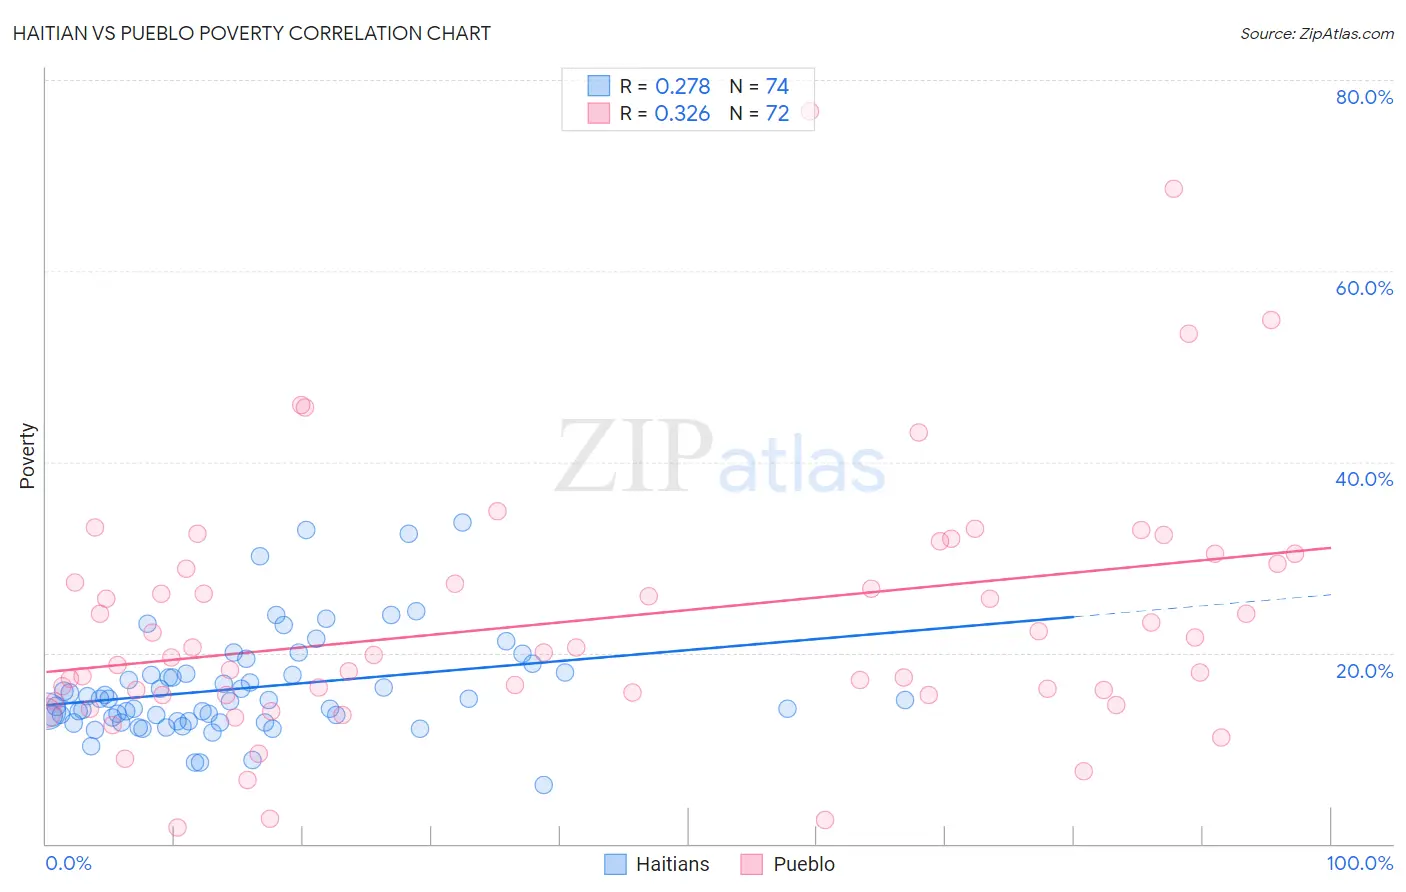
Haitian vs Pueblo Poverty Correlation Chart
The statistical analysis conducted on geographies consisting of 287,739,300 people shows a weak positive correlation between the proportion of Haitians and poverty level in the United States with a correlation coefficient (R) of 0.278 and weighted average of 14.9%. Similarly, the statistical analysis conducted on geographies consisting of 120,076,911 people shows a mild positive correlation between the proportion of Pueblo and poverty level in the United States with a correlation coefficient (R) of 0.326 and weighted average of 19.4%, a difference of 30.3%.
Poverty Correlation Summary
| Measurement | Haitian | Pueblo |
| Minimum | 6.2% | 1.7% |
| Maximum | 33.7% | 76.8% |
| Range | 27.5% | 75.1% |
| Mean | 16.3% | 23.4% |
| Median | 15.1% | 19.9% |
| Interquartile 25% (IQ1) | 12.8% | 15.6% |
| Interquartile 75% (IQ3) | 17.8% | 29.0% |
| Interquartile Range (IQR) | 5.0% | 13.4% |
| Standard Deviation (Sample) | 5.4% | 13.6% |
| Standard Deviation (Population) | 5.4% | 13.5% |
Similar Demographics by Poverty
Demographics Similar to Haitians by Poverty
In terms of poverty, the demographic groups most similar to Haitians are Immigrants from Barbados (14.9%, a difference of 0.070%), Immigrants from St. Vincent and the Grenadines (14.9%, a difference of 0.20%), Comanche (15.0%, a difference of 0.40%), Belizean (14.8%, a difference of 0.49%), and Bangladeshi (14.8%, a difference of 0.51%).
| Demographics | Rating | Rank | Poverty |
| Spanish Americans | 0.0 /100 | #273 | Tragic 14.7% |
| Barbadians | 0.0 /100 | #274 | Tragic 14.8% |
| Immigrants | West Indies | 0.0 /100 | #275 | Tragic 14.8% |
| Immigrants | Bahamas | 0.0 /100 | #276 | Tragic 14.8% |
| Bangladeshis | 0.0 /100 | #277 | Tragic 14.8% |
| Belizeans | 0.0 /100 | #278 | Tragic 14.8% |
| Immigrants | St. Vincent and the Grenadines | 0.0 /100 | #279 | Tragic 14.9% |
| Haitians | 0.0 /100 | #280 | Tragic 14.9% |
| Immigrants | Barbados | 0.0 /100 | #281 | Tragic 14.9% |
| Comanche | 0.0 /100 | #282 | Tragic 15.0% |
| Immigrants | Haiti | 0.0 /100 | #283 | Tragic 15.0% |
| West Indians | 0.0 /100 | #284 | Tragic 15.0% |
| Vietnamese | 0.0 /100 | #285 | Tragic 15.0% |
| Immigrants | Latin America | 0.0 /100 | #286 | Tragic 15.0% |
| Inupiat | 0.0 /100 | #287 | Tragic 15.1% |
Demographics Similar to Pueblo by Poverty
In terms of poverty, the demographic groups most similar to Pueblo are Sioux (19.8%, a difference of 1.9%), Cheyenne (18.9%, a difference of 2.5%), Yuman (20.2%, a difference of 4.1%), Houma (18.4%, a difference of 5.4%), and Apache (18.4%, a difference of 5.4%).
| Demographics | Rating | Rank | Poverty |
| Blacks/African Americans | 0.0 /100 | #329 | Tragic 17.3% |
| Dominicans | 0.0 /100 | #330 | Tragic 17.6% |
| Immigrants | Dominican Republic | 0.0 /100 | #331 | Tragic 17.8% |
| Natives/Alaskans | 0.0 /100 | #332 | Tragic 18.1% |
| Houma | 0.0 /100 | #333 | Tragic 18.4% |
| Apache | 0.0 /100 | #334 | Tragic 18.4% |
| Cheyenne | 0.0 /100 | #335 | Tragic 18.9% |
| Pueblo | 0.0 /100 | #336 | Tragic 19.4% |
| Sioux | 0.0 /100 | #337 | Tragic 19.8% |
| Yuman | 0.0 /100 | #338 | Tragic 20.2% |
| Crow | 0.0 /100 | #339 | Tragic 20.7% |
| Yup'ik | 0.0 /100 | #340 | Tragic 20.8% |
| Hopi | 0.0 /100 | #341 | Tragic 20.8% |
| Immigrants | Yemen | 0.0 /100 | #342 | Tragic 21.5% |
| Pima | 0.0 /100 | #343 | Tragic 21.9% |