Immigrants from Middle Africa vs Alsatian Female Poverty
COMPARE
Immigrants from Middle Africa
Alsatian
Female Poverty
Female Poverty Comparison
Immigrants from Middle Africa
Alsatians
15.2%
FEMALE POVERTY
0.5/ 100
METRIC RATING
239th/ 347
METRIC RANK
14.5%
FEMALE POVERTY
4.0/ 100
METRIC RATING
220th/ 347
METRIC RANK
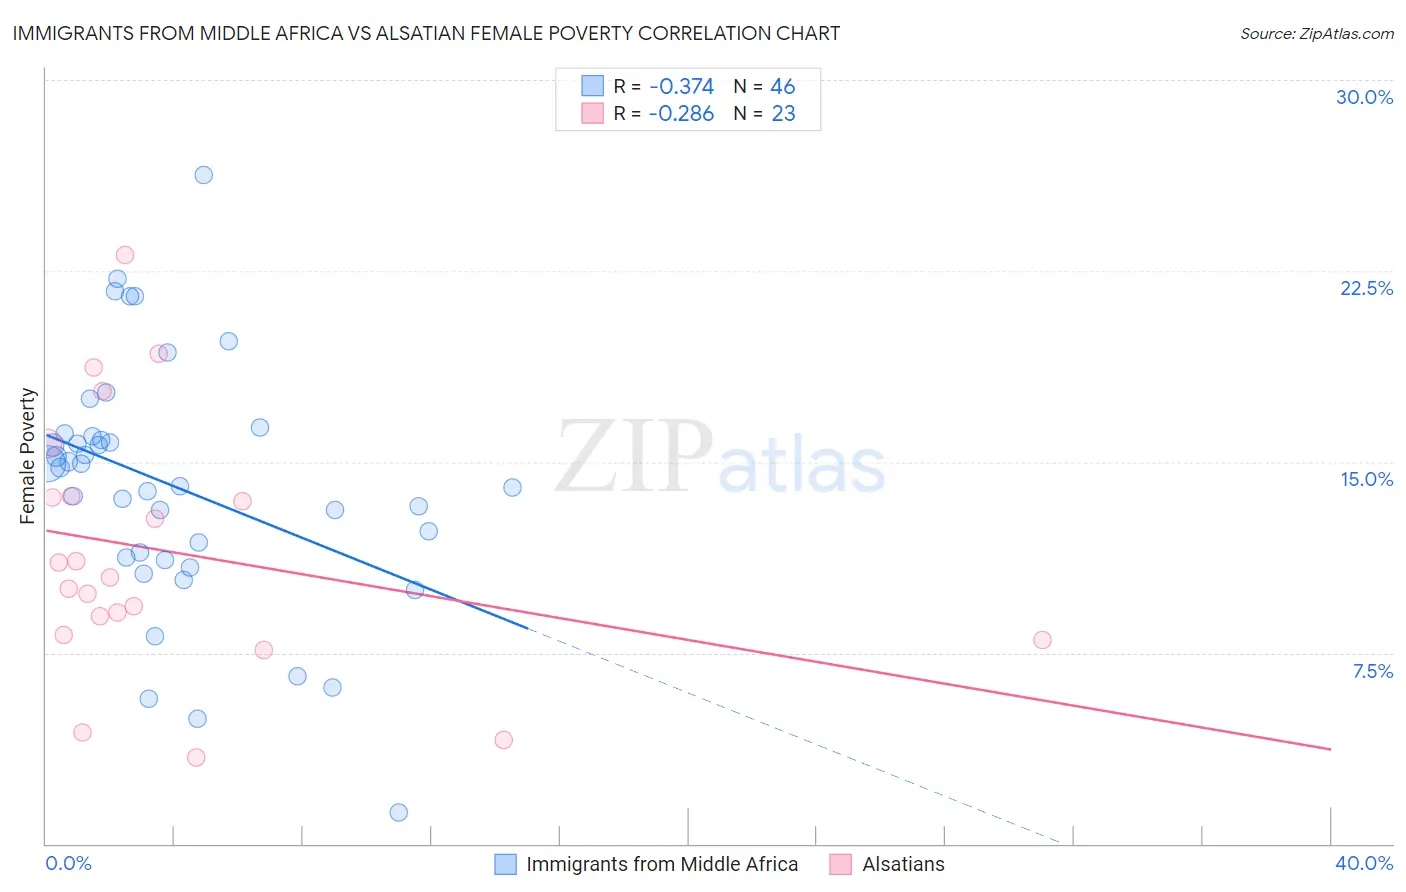
Immigrants from Middle Africa vs Alsatian Female Poverty Correlation Chart
The statistical analysis conducted on geographies consisting of 202,623,141 people shows a mild negative correlation between the proportion of Immigrants from Middle Africa and poverty level among females in the United States with a correlation coefficient (R) of -0.374 and weighted average of 15.2%. Similarly, the statistical analysis conducted on geographies consisting of 82,678,421 people shows a weak negative correlation between the proportion of Alsatians and poverty level among females in the United States with a correlation coefficient (R) of -0.286 and weighted average of 14.5%, a difference of 4.9%.
Female Poverty Correlation Summary
| Measurement | Immigrants from Middle Africa | Alsatian |
| Minimum | 1.2% | 3.4% |
| Maximum | 26.2% | 23.1% |
| Range | 25.0% | 19.7% |
| Mean | 14.0% | 11.5% |
| Median | 14.4% | 10.5% |
| Interquartile 25% (IQ1) | 11.2% | 8.2% |
| Interquartile 75% (IQ3) | 16.0% | 13.7% |
| Interquartile Range (IQR) | 4.8% | 5.5% |
| Standard Deviation (Sample) | 4.9% | 5.0% |
| Standard Deviation (Population) | 4.8% | 4.9% |
Demographics Similar to Immigrants from Middle Africa and Alsatians by Female Poverty
In terms of female poverty, the demographic groups most similar to Immigrants from Middle Africa are Immigrants from Armenia (15.1%, a difference of 0.52%), French American Indian (15.1%, a difference of 0.59%), Cree (15.1%, a difference of 0.78%), Immigrants from Laos (15.0%, a difference of 1.4%), and Fijian (14.9%, a difference of 1.9%). Similarly, the demographic groups most similar to Alsatians are Japanese (14.5%, a difference of 0.050%), Immigrants from Cambodia (14.5%, a difference of 0.19%), Nonimmigrants (14.5%, a difference of 0.22%), Immigrants from Africa (14.5%, a difference of 0.45%), and American (14.6%, a difference of 0.85%).
| Demographics | Rating | Rank | Female Poverty |
| Japanese | 4.1 /100 | #219 | Tragic 14.5% |
| Alsatians | 4.0 /100 | #220 | Tragic 14.5% |
| Immigrants | Cambodia | 3.7 /100 | #221 | Tragic 14.5% |
| Immigrants | Nonimmigrants | 3.7 /100 | #222 | Tragic 14.5% |
| Immigrants | Africa | 3.3 /100 | #223 | Tragic 14.5% |
| Americans | 2.8 /100 | #224 | Tragic 14.6% |
| Immigrants | Micronesia | 2.8 /100 | #225 | Tragic 14.6% |
| Immigrants | Eritrea | 2.4 /100 | #226 | Tragic 14.6% |
| Immigrants | Nigeria | 2.1 /100 | #227 | Tragic 14.7% |
| German Russians | 2.0 /100 | #228 | Tragic 14.7% |
| Ghanaians | 1.9 /100 | #229 | Tragic 14.7% |
| Alaska Natives | 1.8 /100 | #230 | Tragic 14.7% |
| Nigerians | 1.7 /100 | #231 | Tragic 14.8% |
| Osage | 1.5 /100 | #232 | Tragic 14.8% |
| Immigrants | Saudi Arabia | 1.4 /100 | #233 | Tragic 14.8% |
| Fijians | 1.1 /100 | #234 | Tragic 14.9% |
| Immigrants | Laos | 0.9 /100 | #235 | Tragic 15.0% |
| Cree | 0.7 /100 | #236 | Tragic 15.1% |
| French American Indians | 0.6 /100 | #237 | Tragic 15.1% |
| Immigrants | Armenia | 0.6 /100 | #238 | Tragic 15.1% |
| Immigrants | Middle Africa | 0.5 /100 | #239 | Tragic 15.2% |