Immigrants from Middle Africa vs Immigrants from Argentina Disability Age Over 75
COMPARE
Immigrants from Middle Africa
Immigrants from Argentina
Disability Age Over 75
Disability Age Over 75 Comparison
Immigrants from Middle Africa
Immigrants from Argentina
47.1%
DISABILITY AGE OVER 75
68.3/ 100
METRIC RATING
160th/ 347
METRIC RANK
45.9%
DISABILITY AGE OVER 75
99.6/ 100
METRIC RATING
61st/ 347
METRIC RANK
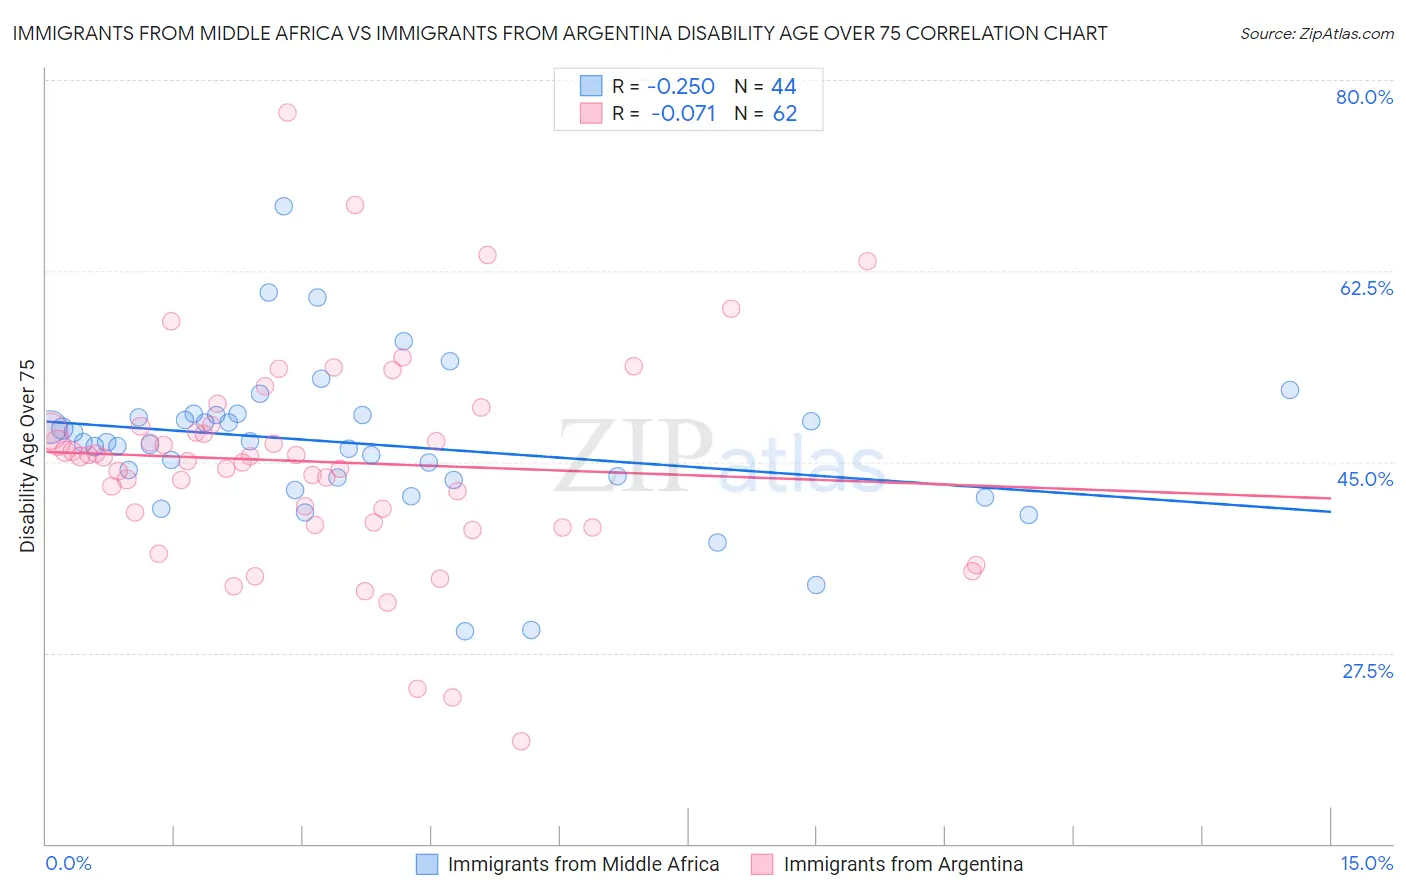
Immigrants from Middle Africa vs Immigrants from Argentina Disability Age Over 75 Correlation Chart
The statistical analysis conducted on geographies consisting of 202,484,916 people shows a weak negative correlation between the proportion of Immigrants from Middle Africa and percentage of population with a disability over the age of 75 in the United States with a correlation coefficient (R) of -0.250 and weighted average of 47.1%. Similarly, the statistical analysis conducted on geographies consisting of 264,260,821 people shows a slight negative correlation between the proportion of Immigrants from Argentina and percentage of population with a disability over the age of 75 in the United States with a correlation coefficient (R) of -0.071 and weighted average of 45.9%, a difference of 2.7%.
Disability Age Over 75 Correlation Summary
| Measurement | Immigrants from Middle Africa | Immigrants from Argentina |
| Minimum | 29.5% | 19.4% |
| Maximum | 68.4% | 77.0% |
| Range | 38.9% | 57.6% |
| Mean | 46.7% | 45.0% |
| Median | 46.8% | 45.4% |
| Interquartile 25% (IQ1) | 43.4% | 39.5% |
| Interquartile 75% (IQ3) | 49.3% | 48.2% |
| Interquartile Range (IQR) | 5.9% | 8.7% |
| Standard Deviation (Sample) | 7.1% | 9.9% |
| Standard Deviation (Population) | 7.1% | 9.8% |
Similar Demographics by Disability Age Over 75
Demographics Similar to Immigrants from Middle Africa by Disability Age Over 75
In terms of disability age over 75, the demographic groups most similar to Immigrants from Middle Africa are South American Indian (47.1%, a difference of 0.010%), Pennsylvania German (47.2%, a difference of 0.060%), Immigrants from Eastern Africa (47.2%, a difference of 0.070%), Immigrants from Morocco (47.1%, a difference of 0.080%), and French (47.2%, a difference of 0.090%).
| Demographics | Rating | Rank | Disability Age Over 75 |
| Immigrants | Zaire | 74.8 /100 | #153 | Good 47.1% |
| Immigrants | Belarus | 74.8 /100 | #154 | Good 47.1% |
| Immigrants | Iran | 74.7 /100 | #155 | Good 47.1% |
| Arabs | 73.3 /100 | #156 | Good 47.1% |
| Bhutanese | 72.6 /100 | #157 | Good 47.1% |
| Immigrants | Guyana | 71.9 /100 | #158 | Good 47.1% |
| Immigrants | Morocco | 71.4 /100 | #159 | Good 47.1% |
| Immigrants | Middle Africa | 68.3 /100 | #160 | Good 47.1% |
| South American Indians | 68.1 /100 | #161 | Good 47.1% |
| Pennsylvania Germans | 66.0 /100 | #162 | Good 47.2% |
| Immigrants | Eastern Africa | 65.5 /100 | #163 | Good 47.2% |
| French | 64.6 /100 | #164 | Good 47.2% |
| Immigrants | Zimbabwe | 64.4 /100 | #165 | Good 47.2% |
| Immigrants | Sierra Leone | 64.4 /100 | #166 | Good 47.2% |
| Moroccans | 62.9 /100 | #167 | Good 47.2% |
Demographics Similar to Immigrants from Argentina by Disability Age Over 75
In terms of disability age over 75, the demographic groups most similar to Immigrants from Argentina are Iranian (45.9%, a difference of 0.020%), Immigrants from Europe (45.9%, a difference of 0.020%), Immigrants from Israel (45.9%, a difference of 0.030%), Burmese (45.9%, a difference of 0.030%), and Immigrants from Turkey (45.9%, a difference of 0.040%).
| Demographics | Rating | Rank | Disability Age Over 75 |
| Slovaks | 99.6 /100 | #54 | Exceptional 45.8% |
| Maltese | 99.6 /100 | #55 | Exceptional 45.8% |
| Immigrants | Netherlands | 99.6 /100 | #56 | Exceptional 45.9% |
| Immigrants | Turkey | 99.6 /100 | #57 | Exceptional 45.9% |
| Immigrants | Israel | 99.6 /100 | #58 | Exceptional 45.9% |
| Iranians | 99.6 /100 | #59 | Exceptional 45.9% |
| Immigrants | Europe | 99.6 /100 | #60 | Exceptional 45.9% |
| Immigrants | Argentina | 99.6 /100 | #61 | Exceptional 45.9% |
| Burmese | 99.5 /100 | #62 | Exceptional 45.9% |
| Immigrants | Norway | 99.5 /100 | #63 | Exceptional 45.9% |
| Immigrants | North Macedonia | 99.5 /100 | #64 | Exceptional 45.9% |
| Austrians | 99.5 /100 | #65 | Exceptional 46.0% |
| Immigrants | England | 99.5 /100 | #66 | Exceptional 46.0% |
| Immigrants | Spain | 99.4 /100 | #67 | Exceptional 46.0% |
| Immigrants | South Central Asia | 99.4 /100 | #68 | Exceptional 46.0% |