Immigrants from Middle Africa vs Immigrants from Argentina 6th Grade
COMPARE
Immigrants from Middle Africa
Immigrants from Argentina
6th Grade
6th Grade Comparison
Immigrants from Middle Africa
Immigrants from Argentina
96.5%
6TH GRADE
0.8/ 100
METRIC RATING
250th/ 347
METRIC RANK
97.0%
6TH GRADE
30.4/ 100
METRIC RATING
188th/ 347
METRIC RANK
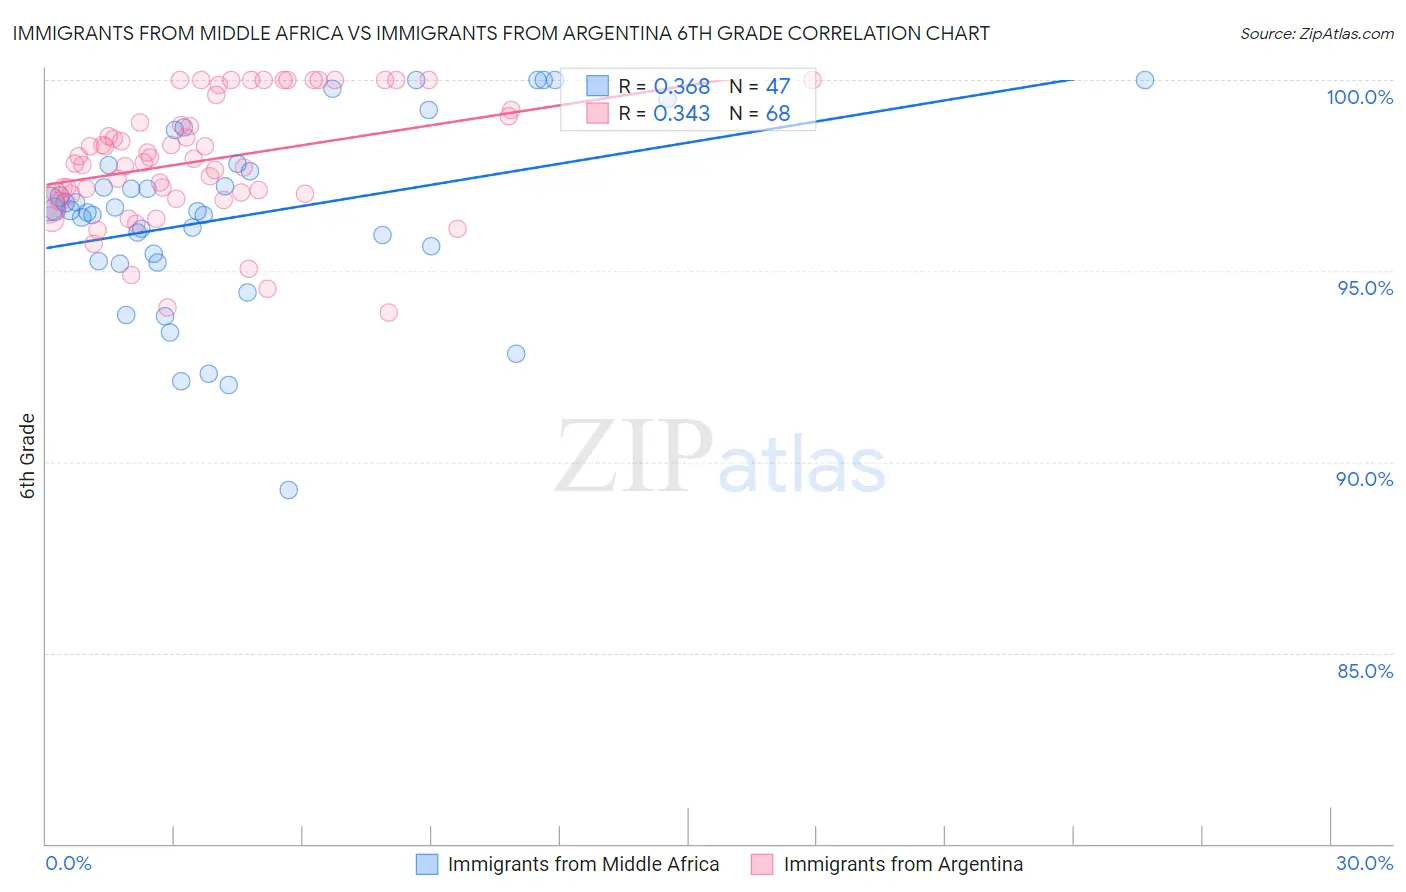
Immigrants from Middle Africa vs Immigrants from Argentina 6th Grade Correlation Chart
The statistical analysis conducted on geographies consisting of 202,721,852 people shows a mild positive correlation between the proportion of Immigrants from Middle Africa and percentage of population with at least 6th grade education in the United States with a correlation coefficient (R) of 0.368 and weighted average of 96.5%. Similarly, the statistical analysis conducted on geographies consisting of 264,434,317 people shows a mild positive correlation between the proportion of Immigrants from Argentina and percentage of population with at least 6th grade education in the United States with a correlation coefficient (R) of 0.343 and weighted average of 97.0%, a difference of 0.46%.
6th Grade Correlation Summary
| Measurement | Immigrants from Middle Africa | Immigrants from Argentina |
| Minimum | 89.2% | 93.9% |
| Maximum | 100.0% | 100.0% |
| Range | 10.8% | 6.1% |
| Mean | 96.4% | 97.9% |
| Median | 96.6% | 97.9% |
| Interquartile 25% (IQ1) | 95.3% | 97.0% |
| Interquartile 75% (IQ3) | 97.8% | 99.1% |
| Interquartile Range (IQR) | 2.5% | 2.1% |
| Standard Deviation (Sample) | 2.4% | 1.6% |
| Standard Deviation (Population) | 2.4% | 1.6% |
Similar Demographics by 6th Grade
Demographics Similar to Immigrants from Middle Africa by 6th Grade
In terms of 6th grade, the demographic groups most similar to Immigrants from Middle Africa are Tohono O'odham (96.5%, a difference of 0.020%), Colombian (96.5%, a difference of 0.020%), Immigrants from Senegal (96.5%, a difference of 0.020%), Immigrants from Uruguay (96.5%, a difference of 0.020%), and Bolivian (96.5%, a difference of 0.030%).
| Demographics | Rating | Rank | 6th Grade |
| Immigrants | Liberia | 1.6 /100 | #243 | Tragic 96.6% |
| Ethiopians | 1.5 /100 | #244 | Tragic 96.6% |
| Immigrants | Costa Rica | 1.3 /100 | #245 | Tragic 96.6% |
| Immigrants | Africa | 1.3 /100 | #246 | Tragic 96.6% |
| Bolivians | 1.0 /100 | #247 | Tragic 96.5% |
| Tohono O'odham | 1.0 /100 | #248 | Tragic 96.5% |
| Colombians | 0.9 /100 | #249 | Tragic 96.5% |
| Immigrants | Middle Africa | 0.8 /100 | #250 | Tragic 96.5% |
| Immigrants | Senegal | 0.7 /100 | #251 | Tragic 96.5% |
| Immigrants | Uruguay | 0.6 /100 | #252 | Tragic 96.5% |
| Jamaicans | 0.6 /100 | #253 | Tragic 96.5% |
| Immigrants | Ethiopia | 0.6 /100 | #254 | Tragic 96.5% |
| Immigrants | Congo | 0.6 /100 | #255 | Tragic 96.5% |
| U.S. Virgin Islanders | 0.5 /100 | #256 | Tragic 96.5% |
| Taiwanese | 0.5 /100 | #257 | Tragic 96.5% |
Demographics Similar to Immigrants from Argentina by 6th Grade
In terms of 6th grade, the demographic groups most similar to Immigrants from Argentina are Guamanian/Chamorro (97.0%, a difference of 0.0%), Black/African American (97.0%, a difference of 0.0%), Argentinean (97.0%, a difference of 0.010%), Immigrants from Egypt (97.0%, a difference of 0.010%), and Dutch West Indian (96.9%, a difference of 0.010%).
| Demographics | Rating | Rank | 6th Grade |
| Comanche | 37.9 /100 | #181 | Fair 97.0% |
| Immigrants | Ukraine | 35.6 /100 | #182 | Fair 97.0% |
| Immigrants | Venezuela | 34.5 /100 | #183 | Fair 97.0% |
| Spanish Americans | 33.5 /100 | #184 | Fair 97.0% |
| Argentineans | 33.0 /100 | #185 | Fair 97.0% |
| Immigrants | Egypt | 31.4 /100 | #186 | Fair 97.0% |
| Guamanians/Chamorros | 30.6 /100 | #187 | Fair 97.0% |
| Immigrants | Argentina | 30.4 /100 | #188 | Fair 97.0% |
| Blacks/African Americans | 30.2 /100 | #189 | Fair 97.0% |
| Dutch West Indians | 28.3 /100 | #190 | Fair 96.9% |
| Panamanians | 27.3 /100 | #191 | Fair 96.9% |
| Hawaiians | 27.0 /100 | #192 | Fair 96.9% |
| Paraguayans | 26.6 /100 | #193 | Fair 96.9% |
| Immigrants | Lebanon | 25.6 /100 | #194 | Fair 96.9% |
| Immigrants | Brazil | 25.5 /100 | #195 | Fair 96.9% |