Immigrants from Malaysia vs Pakistani Male Poverty
COMPARE
Immigrants from Malaysia
Pakistani
Male Poverty
Male Poverty Comparison
Immigrants from Malaysia
Pakistanis
11.0%
MALE POVERTY
64.7/ 100
METRIC RATING
155th/ 347
METRIC RANK
10.8%
MALE POVERTY
83.0/ 100
METRIC RATING
133rd/ 347
METRIC RANK
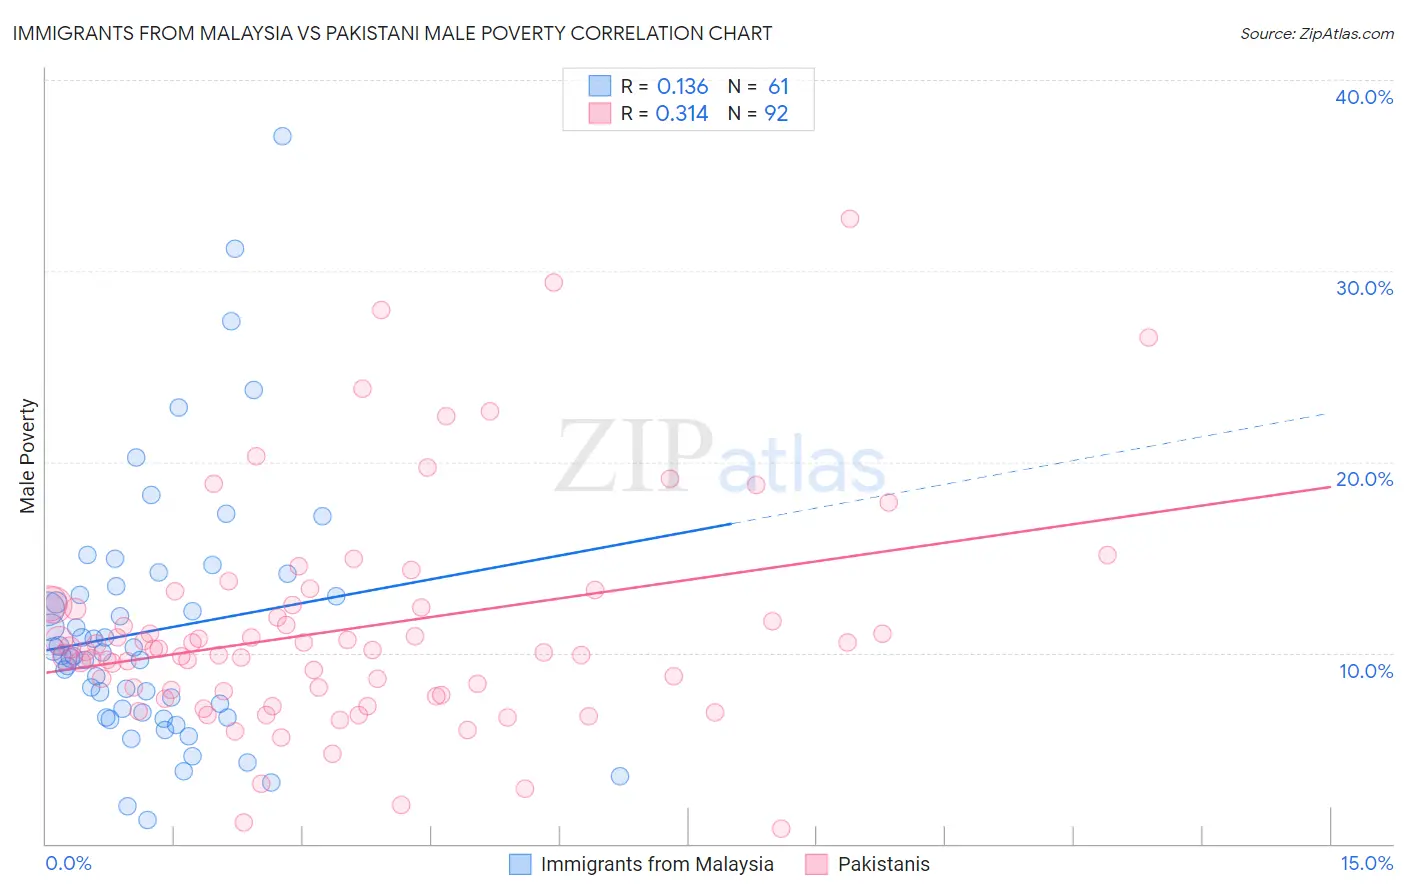
Immigrants from Malaysia vs Pakistani Male Poverty Correlation Chart
The statistical analysis conducted on geographies consisting of 197,921,131 people shows a poor positive correlation between the proportion of Immigrants from Malaysia and poverty level among males in the United States with a correlation coefficient (R) of 0.136 and weighted average of 11.0%. Similarly, the statistical analysis conducted on geographies consisting of 335,136,890 people shows a mild positive correlation between the proportion of Pakistanis and poverty level among males in the United States with a correlation coefficient (R) of 0.314 and weighted average of 10.8%, a difference of 2.5%.
Male Poverty Correlation Summary
| Measurement | Immigrants from Malaysia | Pakistani |
| Minimum | 1.3% | 0.75% |
| Maximum | 37.1% | 32.7% |
| Range | 35.8% | 32.0% |
| Mean | 11.2% | 11.2% |
| Median | 9.9% | 10.2% |
| Interquartile 25% (IQ1) | 6.8% | 7.9% |
| Interquartile 75% (IQ3) | 13.2% | 12.5% |
| Interquartile Range (IQR) | 6.5% | 4.6% |
| Standard Deviation (Sample) | 6.7% | 5.8% |
| Standard Deviation (Population) | 6.6% | 5.8% |
Similar Demographics by Male Poverty
Demographics Similar to Immigrants from Malaysia by Male Poverty
In terms of male poverty, the demographic groups most similar to Immigrants from Malaysia are Immigrants from Kazakhstan (11.0%, a difference of 0.010%), Immigrants from Bosnia and Herzegovina (11.0%, a difference of 0.050%), Costa Rican (11.0%, a difference of 0.090%), Scotch-Irish (11.0%, a difference of 0.11%), and Colombian (11.0%, a difference of 0.19%).
| Demographics | Rating | Rank | Male Poverty |
| Armenians | 68.0 /100 | #148 | Good 11.0% |
| Immigrants | Venezuela | 67.9 /100 | #149 | Good 11.0% |
| Guamanians/Chamorros | 67.6 /100 | #150 | Good 11.0% |
| Venezuelans | 67.4 /100 | #151 | Good 11.0% |
| Immigrants | Nepal | 67.3 /100 | #152 | Good 11.0% |
| Immigrants | Bosnia and Herzegovina | 65.2 /100 | #153 | Good 11.0% |
| Immigrants | Kazakhstan | 64.8 /100 | #154 | Good 11.0% |
| Immigrants | Malaysia | 64.7 /100 | #155 | Good 11.0% |
| Costa Ricans | 63.9 /100 | #156 | Good 11.0% |
| Scotch-Irish | 63.7 /100 | #157 | Good 11.0% |
| Colombians | 63.0 /100 | #158 | Good 11.0% |
| Taiwanese | 62.7 /100 | #159 | Good 11.0% |
| Soviet Union | 60.3 /100 | #160 | Good 11.1% |
| Immigrants | Northern Africa | 59.7 /100 | #161 | Average 11.1% |
| Immigrants | Chile | 57.4 /100 | #162 | Average 11.1% |
Demographics Similar to Pakistanis by Male Poverty
In terms of male poverty, the demographic groups most similar to Pakistanis are Immigrants from Vietnam (10.8%, a difference of 0.010%), New Zealander (10.8%, a difference of 0.010%), Brazilian (10.8%, a difference of 0.050%), Immigrants from Belarus (10.7%, a difference of 0.060%), and Chilean (10.7%, a difference of 0.17%).
| Demographics | Rating | Rank | Male Poverty |
| Immigrants | Ukraine | 84.3 /100 | #126 | Excellent 10.7% |
| Puget Sound Salish | 84.3 /100 | #127 | Excellent 10.7% |
| Immigrants | Western Europe | 84.2 /100 | #128 | Excellent 10.7% |
| Immigrants | Peru | 84.1 /100 | #129 | Excellent 10.7% |
| Chileans | 83.9 /100 | #130 | Excellent 10.7% |
| Immigrants | Belarus | 83.3 /100 | #131 | Excellent 10.7% |
| Immigrants | Vietnam | 83.0 /100 | #132 | Excellent 10.8% |
| Pakistanis | 83.0 /100 | #133 | Excellent 10.8% |
| New Zealanders | 82.9 /100 | #134 | Excellent 10.8% |
| Brazilians | 82.7 /100 | #135 | Excellent 10.8% |
| Immigrants | Israel | 80.9 /100 | #136 | Excellent 10.8% |
| Immigrants | Switzerland | 79.2 /100 | #137 | Good 10.8% |
| Yugoslavians | 78.2 /100 | #138 | Good 10.8% |
| Immigrants | Jordan | 77.5 /100 | #139 | Good 10.8% |
| Tlingit-Haida | 76.1 /100 | #140 | Good 10.9% |