Immigrants from Malaysia vs Pakistani 1st Grade
COMPARE
Immigrants from Malaysia
Pakistani
1st Grade
1st Grade Comparison
Immigrants from Malaysia
Pakistanis
97.6%
1ST GRADE
2.1/ 100
METRIC RATING
235th/ 347
METRIC RANK
97.9%
1ST GRADE
35.8/ 100
METRIC RATING
187th/ 347
METRIC RANK
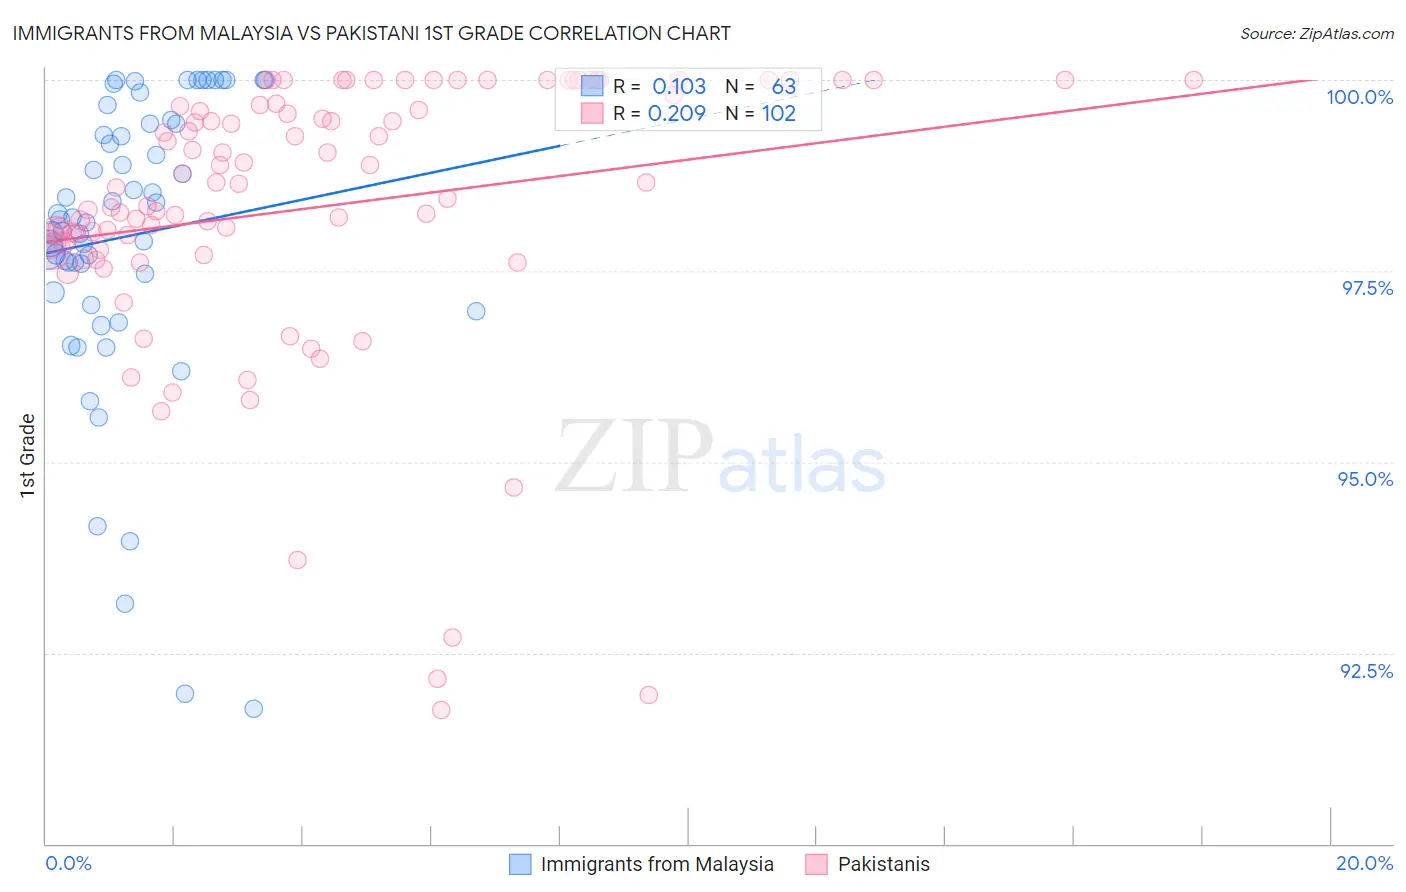
Immigrants from Malaysia vs Pakistani 1st Grade Correlation Chart
The statistical analysis conducted on geographies consisting of 197,973,709 people shows a poor positive correlation between the proportion of Immigrants from Malaysia and percentage of population with at least 1st grade education in the United States with a correlation coefficient (R) of 0.103 and weighted average of 97.6%. Similarly, the statistical analysis conducted on geographies consisting of 335,355,426 people shows a weak positive correlation between the proportion of Pakistanis and percentage of population with at least 1st grade education in the United States with a correlation coefficient (R) of 0.209 and weighted average of 97.9%, a difference of 0.25%.
1st Grade Correlation Summary
| Measurement | Immigrants from Malaysia | Pakistani |
| Minimum | 91.8% | 91.8% |
| Maximum | 100.0% | 100.0% |
| Range | 8.2% | 8.2% |
| Mean | 98.0% | 98.3% |
| Median | 98.2% | 98.6% |
| Interquartile 25% (IQ1) | 97.2% | 97.8% |
| Interquartile 75% (IQ3) | 99.4% | 99.7% |
| Interquartile Range (IQR) | 2.2% | 1.9% |
| Standard Deviation (Sample) | 1.9% | 1.8% |
| Standard Deviation (Population) | 1.9% | 1.8% |
Similar Demographics by 1st Grade
Demographics Similar to Immigrants from Malaysia by 1st Grade
In terms of 1st grade, the demographic groups most similar to Immigrants from Malaysia are Immigrants from Pakistan (97.6%, a difference of 0.0%), Colombian (97.6%, a difference of 0.0%), Immigrants from Western Asia (97.6%, a difference of 0.0%), Immigrants from Uruguay (97.6%, a difference of 0.010%), and U.S. Virgin Islander (97.6%, a difference of 0.010%).
| Demographics | Rating | Rank | 1st Grade |
| Sub-Saharan Africans | 3.6 /100 | #228 | Tragic 97.7% |
| Immigrants | Costa Rica | 3.5 /100 | #229 | Tragic 97.7% |
| Senegalese | 3.5 /100 | #230 | Tragic 97.7% |
| Puerto Ricans | 3.0 /100 | #231 | Tragic 97.7% |
| Immigrants | Uruguay | 2.5 /100 | #232 | Tragic 97.6% |
| Immigrants | Pakistan | 2.2 /100 | #233 | Tragic 97.6% |
| Colombians | 2.2 /100 | #234 | Tragic 97.6% |
| Immigrants | Malaysia | 2.1 /100 | #235 | Tragic 97.6% |
| Immigrants | Western Asia | 2.1 /100 | #236 | Tragic 97.6% |
| U.S. Virgin Islanders | 1.9 /100 | #237 | Tragic 97.6% |
| Nigerians | 1.8 /100 | #238 | Tragic 97.6% |
| Immigrants | Eastern Asia | 1.6 /100 | #239 | Tragic 97.6% |
| Koreans | 1.5 /100 | #240 | Tragic 97.6% |
| Liberians | 1.4 /100 | #241 | Tragic 97.6% |
| Immigrants | Indonesia | 1.2 /100 | #242 | Tragic 97.6% |
Demographics Similar to Pakistanis by 1st Grade
In terms of 1st grade, the demographic groups most similar to Pakistanis are Paiute (97.9%, a difference of 0.0%), Arab (97.9%, a difference of 0.0%), Immigrants from Kazakhstan (97.9%, a difference of 0.0%), Immigrants from Poland (97.9%, a difference of 0.010%), and Immigrants from Belarus (97.9%, a difference of 0.010%).
| Demographics | Rating | Rank | 1st Grade |
| Immigrants | Bosnia and Herzegovina | 46.6 /100 | #180 | Average 97.9% |
| Portuguese | 44.2 /100 | #181 | Average 97.9% |
| Egyptians | 42.7 /100 | #182 | Average 97.9% |
| Immigrants | Argentina | 41.3 /100 | #183 | Average 97.9% |
| Immigrants | Poland | 40.1 /100 | #184 | Average 97.9% |
| Immigrants | Belarus | 39.3 /100 | #185 | Fair 97.9% |
| Paiute | 36.5 /100 | #186 | Fair 97.9% |
| Pakistanis | 35.8 /100 | #187 | Fair 97.9% |
| Arabs | 35.5 /100 | #188 | Fair 97.9% |
| Immigrants | Kazakhstan | 34.9 /100 | #189 | Fair 97.9% |
| Panamanians | 34.1 /100 | #190 | Fair 97.9% |
| Blacks/African Americans | 30.7 /100 | #191 | Fair 97.9% |
| Paraguayans | 30.2 /100 | #192 | Fair 97.9% |
| Immigrants | Taiwan | 29.4 /100 | #193 | Fair 97.9% |
| Mongolians | 29.2 /100 | #194 | Fair 97.9% |