Immigrants from Malaysia vs Pakistani Median Male Earnings
COMPARE
Immigrants from Malaysia
Pakistani
Median Male Earnings
Median Male Earnings Comparison
Immigrants from Malaysia
Pakistanis
$62,121
MEDIAN MALE EARNINGS
99.9/ 100
METRIC RATING
48th/ 347
METRIC RANK
$56,719
MEDIAN MALE EARNINGS
89.9/ 100
METRIC RATING
129th/ 347
METRIC RANK
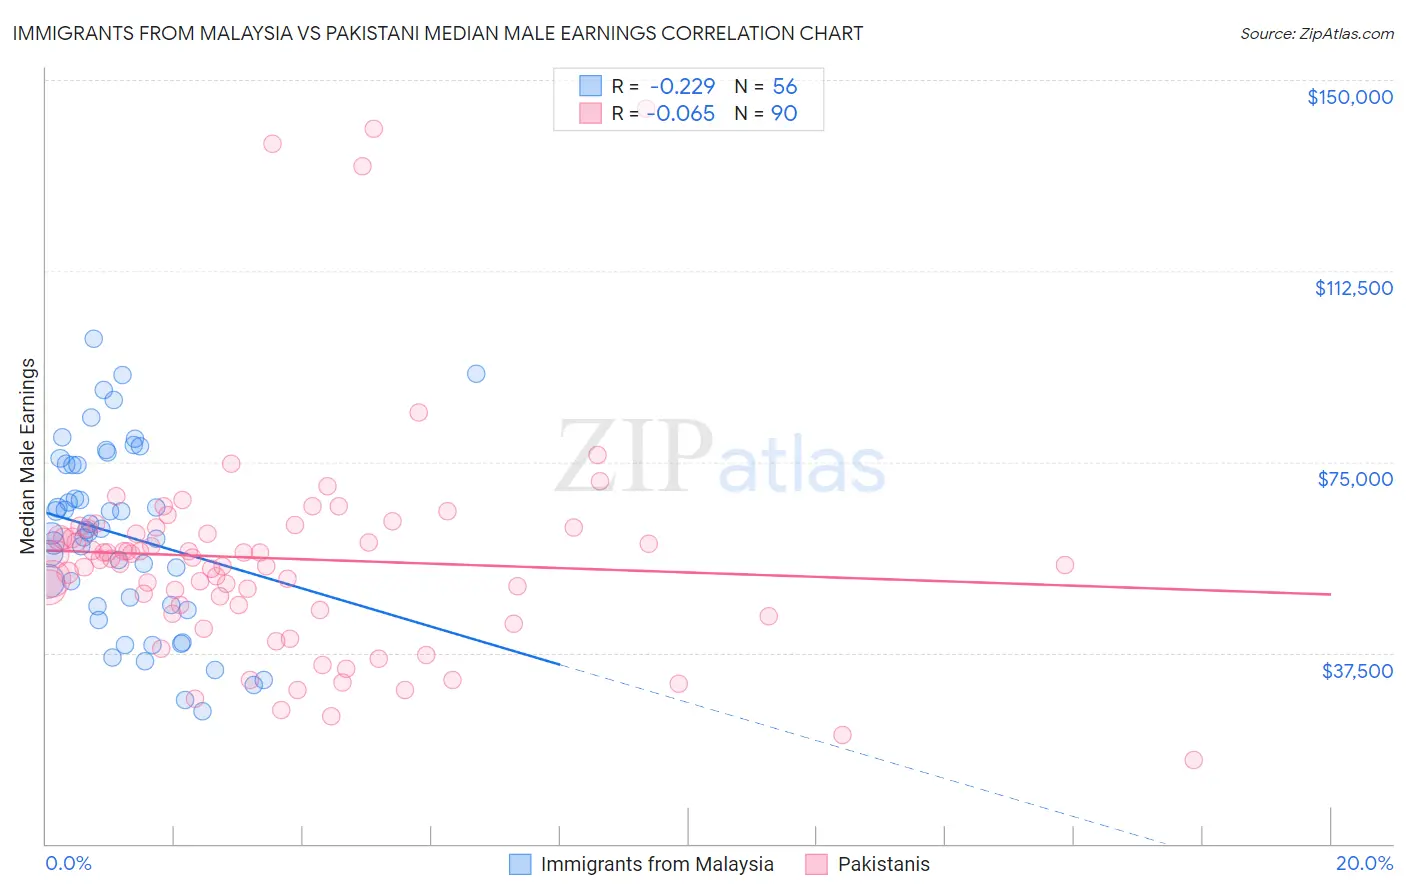
Immigrants from Malaysia vs Pakistani Median Male Earnings Correlation Chart
The statistical analysis conducted on geographies consisting of 197,949,905 people shows a weak negative correlation between the proportion of Immigrants from Malaysia and median male earnings in the United States with a correlation coefficient (R) of -0.229 and weighted average of $62,121. Similarly, the statistical analysis conducted on geographies consisting of 335,324,155 people shows a slight negative correlation between the proportion of Pakistanis and median male earnings in the United States with a correlation coefficient (R) of -0.065 and weighted average of $56,719, a difference of 9.5%.
Median Male Earnings Correlation Summary
| Measurement | Immigrants from Malaysia | Pakistani |
| Minimum | $25,921 | $16,406 |
| Maximum | $99,264 | $144,236 |
| Range | $73,343 | $127,830 |
| Mean | $60,570 | $56,003 |
| Median | $61,469 | $55,878 |
| Interquartile 25% (IQ1) | $46,765 | $45,960 |
| Interquartile 75% (IQ3) | $74,461 | $61,933 |
| Interquartile Range (IQR) | $27,696 | $15,973 |
| Standard Deviation (Sample) | $17,826 | $22,100 |
| Standard Deviation (Population) | $17,666 | $21,977 |
Similar Demographics by Median Male Earnings
Demographics Similar to Immigrants from Malaysia by Median Male Earnings
In terms of median male earnings, the demographic groups most similar to Immigrants from Malaysia are Immigrants from Austria ($62,164, a difference of 0.070%), Immigrants from Europe ($62,057, a difference of 0.10%), Immigrants from Czechoslovakia ($62,217, a difference of 0.15%), Bulgarian ($62,378, a difference of 0.41%), and Bhutanese ($61,759, a difference of 0.59%).
| Demographics | Rating | Rank | Median Male Earnings |
| Immigrants | Turkey | 100.0 /100 | #41 | Exceptional $62,728 |
| Immigrants | Greece | 100.0 /100 | #42 | Exceptional $62,689 |
| Immigrants | Belarus | 100.0 /100 | #43 | Exceptional $62,658 |
| Cambodians | 100.0 /100 | #44 | Exceptional $62,516 |
| Bulgarians | 100.0 /100 | #45 | Exceptional $62,378 |
| Immigrants | Czechoslovakia | 99.9 /100 | #46 | Exceptional $62,217 |
| Immigrants | Austria | 99.9 /100 | #47 | Exceptional $62,164 |
| Immigrants | Malaysia | 99.9 /100 | #48 | Exceptional $62,121 |
| Immigrants | Europe | 99.9 /100 | #49 | Exceptional $62,057 |
| Bhutanese | 99.9 /100 | #50 | Exceptional $61,759 |
| Estonians | 99.9 /100 | #51 | Exceptional $61,710 |
| Immigrants | Norway | 99.9 /100 | #52 | Exceptional $61,628 |
| South Africans | 99.9 /100 | #53 | Exceptional $61,460 |
| Immigrants | Latvia | 99.9 /100 | #54 | Exceptional $61,422 |
| Greeks | 99.9 /100 | #55 | Exceptional $61,242 |
Demographics Similar to Pakistanis by Median Male Earnings
In terms of median male earnings, the demographic groups most similar to Pakistanis are Korean ($56,672, a difference of 0.080%), Portuguese ($56,663, a difference of 0.10%), Immigrants from Syria ($56,830, a difference of 0.20%), Brazilian ($56,837, a difference of 0.21%), and Chinese ($56,872, a difference of 0.27%).
| Demographics | Rating | Rank | Median Male Earnings |
| Immigrants | Jordan | 93.1 /100 | #122 | Exceptional $57,145 |
| Slovenes | 93.1 /100 | #123 | Exceptional $57,145 |
| Chileans | 91.9 /100 | #124 | Exceptional $56,973 |
| Immigrants | Morocco | 91.8 /100 | #125 | Exceptional $56,958 |
| Chinese | 91.1 /100 | #126 | Exceptional $56,872 |
| Brazilians | 90.9 /100 | #127 | Exceptional $56,837 |
| Immigrants | Syria | 90.8 /100 | #128 | Exceptional $56,830 |
| Pakistanis | 89.9 /100 | #129 | Excellent $56,719 |
| Koreans | 89.4 /100 | #130 | Excellent $56,672 |
| Portuguese | 89.4 /100 | #131 | Excellent $56,663 |
| Czechs | 88.2 /100 | #132 | Excellent $56,546 |
| Immigrants | Germany | 88.2 /100 | #133 | Excellent $56,542 |
| Moroccans | 87.7 /100 | #134 | Excellent $56,499 |
| Irish | 87.4 /100 | #135 | Excellent $56,464 |
| Immigrants | Saudi Arabia | 87.2 /100 | #136 | Excellent $56,452 |