Immigrants from Bosnia and Herzegovina vs Pakistani Male Poverty
COMPARE
Immigrants from Bosnia and Herzegovina
Pakistani
Male Poverty
Male Poverty Comparison
Immigrants from Bosnia and Herzegovina
Pakistanis
11.0%
MALE POVERTY
65.2/ 100
METRIC RATING
153rd/ 347
METRIC RANK
10.8%
MALE POVERTY
83.0/ 100
METRIC RATING
133rd/ 347
METRIC RANK
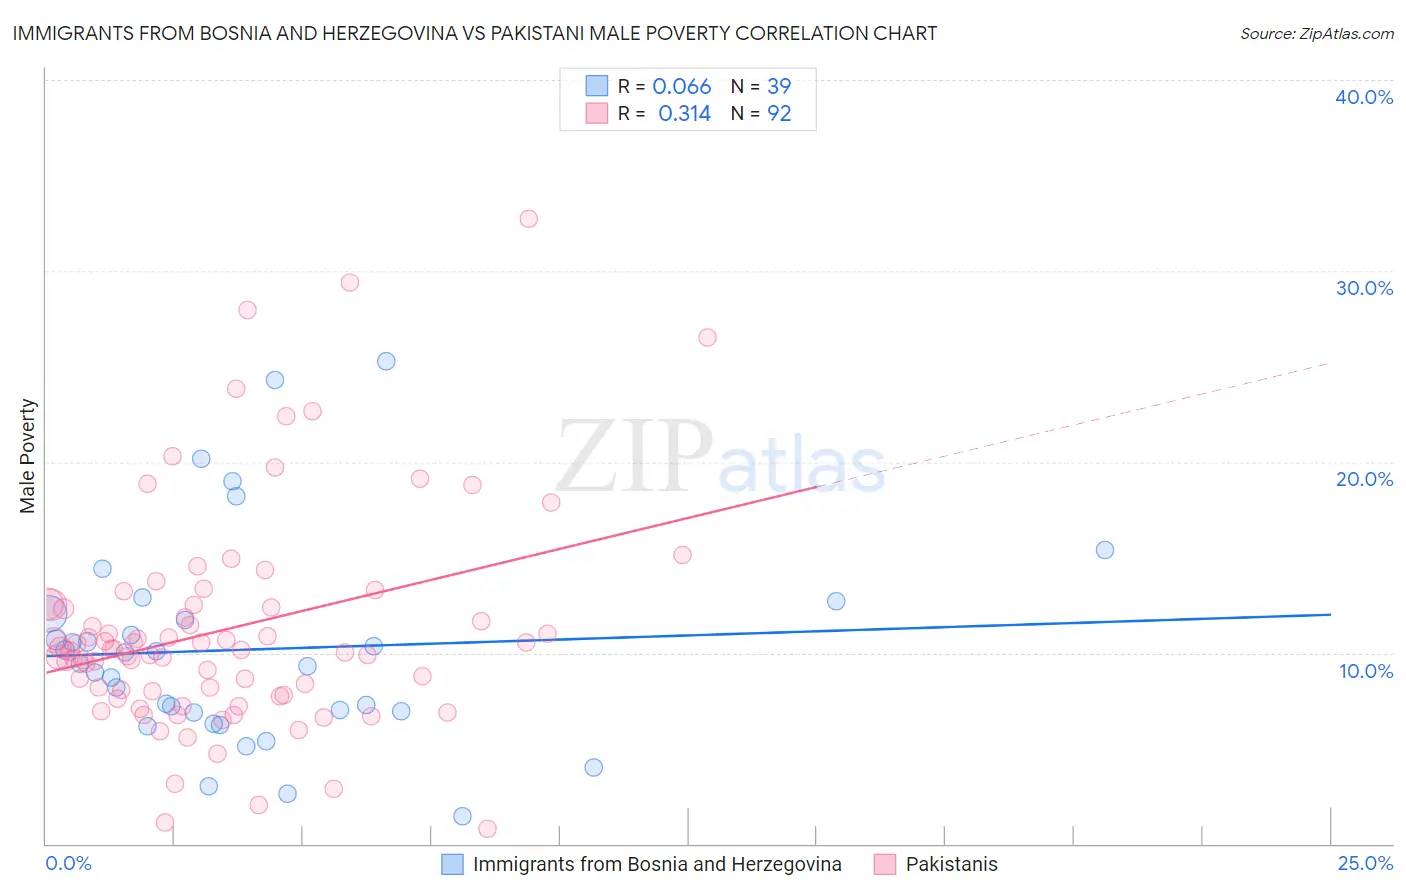
Immigrants from Bosnia and Herzegovina vs Pakistani Male Poverty Correlation Chart
The statistical analysis conducted on geographies consisting of 156,800,336 people shows a slight positive correlation between the proportion of Immigrants from Bosnia and Herzegovina and poverty level among males in the United States with a correlation coefficient (R) of 0.066 and weighted average of 11.0%. Similarly, the statistical analysis conducted on geographies consisting of 335,136,890 people shows a mild positive correlation between the proportion of Pakistanis and poverty level among males in the United States with a correlation coefficient (R) of 0.314 and weighted average of 10.8%, a difference of 2.4%.
Male Poverty Correlation Summary
| Measurement | Immigrants from Bosnia and Herzegovina | Pakistani |
| Minimum | 1.4% | 0.75% |
| Maximum | 25.3% | 32.7% |
| Range | 23.9% | 32.0% |
| Mean | 10.2% | 11.2% |
| Median | 9.4% | 10.2% |
| Interquartile 25% (IQ1) | 6.9% | 7.9% |
| Interquartile 75% (IQ3) | 12.0% | 12.5% |
| Interquartile Range (IQR) | 5.1% | 4.6% |
| Standard Deviation (Sample) | 5.4% | 5.8% |
| Standard Deviation (Population) | 5.4% | 5.8% |
Demographics Similar to Immigrants from Bosnia and Herzegovina and Pakistanis by Male Poverty
In terms of male poverty, the demographic groups most similar to Immigrants from Bosnia and Herzegovina are Immigrants from Nepal (11.0%, a difference of 0.23%), Venezuelan (11.0%, a difference of 0.24%), Guamanian/Chamorro (11.0%, a difference of 0.26%), Immigrants from Venezuela (11.0%, a difference of 0.30%), and Armenian (11.0%, a difference of 0.31%). Similarly, the demographic groups most similar to Pakistanis are New Zealander (10.8%, a difference of 0.010%), Brazilian (10.8%, a difference of 0.050%), Immigrants from Israel (10.8%, a difference of 0.36%), Immigrants from Switzerland (10.8%, a difference of 0.62%), and Yugoslavian (10.8%, a difference of 0.78%).
| Demographics | Rating | Rank | Male Poverty |
| Pakistanis | 83.0 /100 | #133 | Excellent 10.8% |
| New Zealanders | 82.9 /100 | #134 | Excellent 10.8% |
| Brazilians | 82.7 /100 | #135 | Excellent 10.8% |
| Immigrants | Israel | 80.9 /100 | #136 | Excellent 10.8% |
| Immigrants | Switzerland | 79.2 /100 | #137 | Good 10.8% |
| Yugoslavians | 78.2 /100 | #138 | Good 10.8% |
| Immigrants | Jordan | 77.5 /100 | #139 | Good 10.8% |
| Tlingit-Haida | 76.1 /100 | #140 | Good 10.9% |
| Immigrants | France | 75.8 /100 | #141 | Good 10.9% |
| Basques | 74.6 /100 | #142 | Good 10.9% |
| Afghans | 71.9 /100 | #143 | Good 10.9% |
| Samoans | 71.8 /100 | #144 | Good 10.9% |
| Immigrants | Germany | 71.6 /100 | #145 | Good 10.9% |
| Syrians | 71.4 /100 | #146 | Good 10.9% |
| Icelanders | 68.5 /100 | #147 | Good 11.0% |
| Armenians | 68.0 /100 | #148 | Good 11.0% |
| Immigrants | Venezuela | 67.9 /100 | #149 | Good 11.0% |
| Guamanians/Chamorros | 67.6 /100 | #150 | Good 11.0% |
| Venezuelans | 67.4 /100 | #151 | Good 11.0% |
| Immigrants | Nepal | 67.3 /100 | #152 | Good 11.0% |
| Immigrants | Bosnia and Herzegovina | 65.2 /100 | #153 | Good 11.0% |