Immigrants from Panama vs Pakistani Male Poverty
COMPARE
Immigrants from Panama
Pakistani
Male Poverty
Male Poverty Comparison
Immigrants from Panama
Pakistanis
12.1%
MALE POVERTY
4.0/ 100
METRIC RATING
211th/ 347
METRIC RANK
10.8%
MALE POVERTY
83.0/ 100
METRIC RATING
133rd/ 347
METRIC RANK
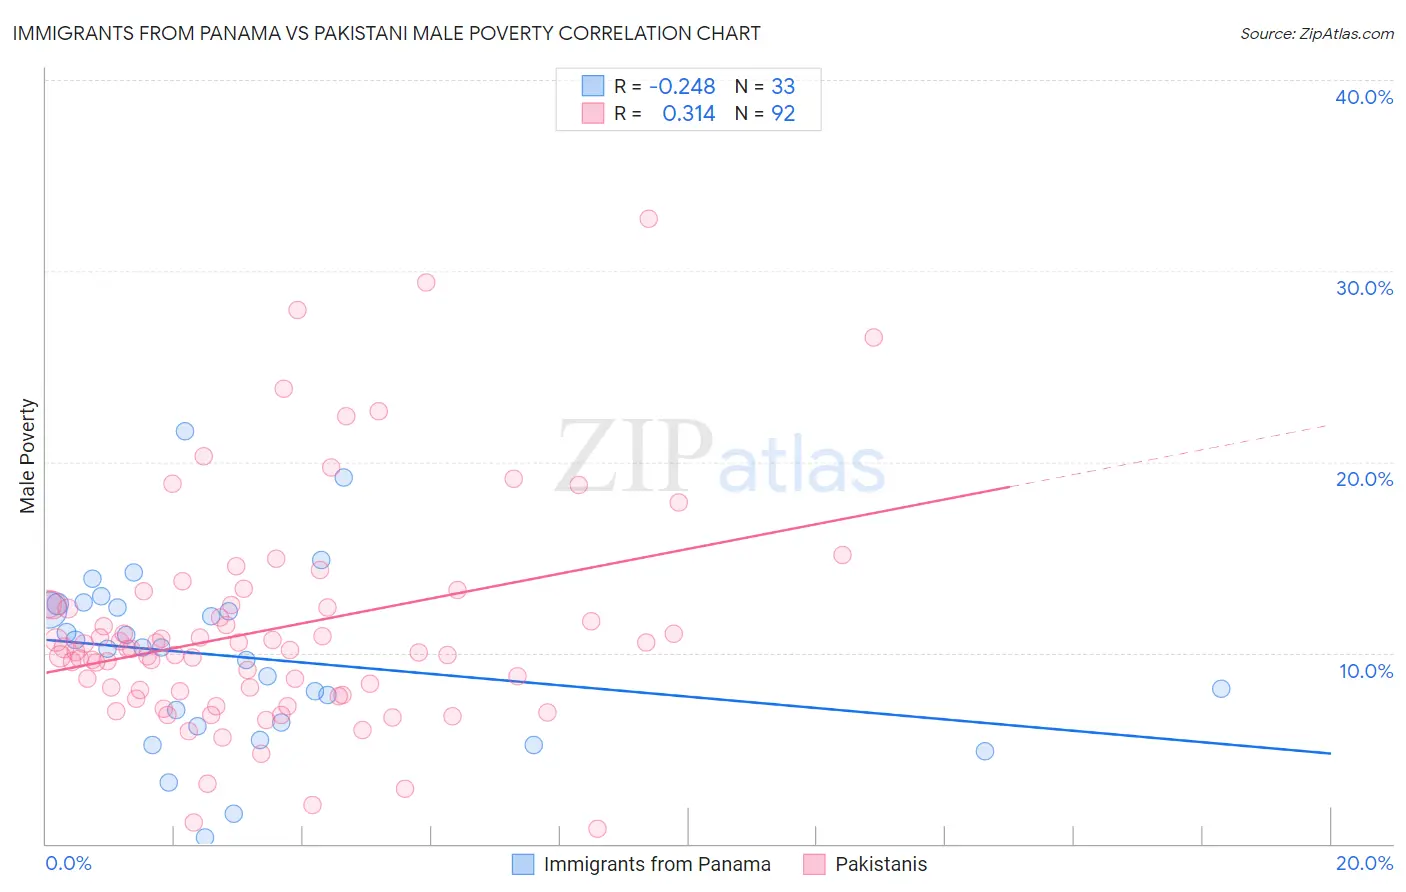
Immigrants from Panama vs Pakistani Male Poverty Correlation Chart
The statistical analysis conducted on geographies consisting of 221,141,756 people shows a weak negative correlation between the proportion of Immigrants from Panama and poverty level among males in the United States with a correlation coefficient (R) of -0.248 and weighted average of 12.1%. Similarly, the statistical analysis conducted on geographies consisting of 335,136,890 people shows a mild positive correlation between the proportion of Pakistanis and poverty level among males in the United States with a correlation coefficient (R) of 0.314 and weighted average of 10.8%, a difference of 12.1%.
Male Poverty Correlation Summary
| Measurement | Immigrants from Panama | Pakistani |
| Minimum | 0.30% | 0.75% |
| Maximum | 21.6% | 32.7% |
| Range | 21.3% | 32.0% |
| Mean | 9.7% | 11.2% |
| Median | 10.3% | 10.2% |
| Interquartile 25% (IQ1) | 6.3% | 7.9% |
| Interquartile 75% (IQ3) | 12.5% | 12.5% |
| Interquartile Range (IQR) | 6.2% | 4.6% |
| Standard Deviation (Sample) | 4.6% | 5.8% |
| Standard Deviation (Population) | 4.5% | 5.8% |
Similar Demographics by Male Poverty
Demographics Similar to Immigrants from Panama by Male Poverty
In terms of male poverty, the demographic groups most similar to Immigrants from Panama are Moroccan (12.0%, a difference of 0.12%), Immigrants from the Azores (12.0%, a difference of 0.17%), Immigrants (12.0%, a difference of 0.29%), American (12.1%, a difference of 0.56%), and Nonimmigrants (12.1%, a difference of 0.60%).
| Demographics | Rating | Rank | Male Poverty |
| Immigrants | Uganda | 8.5 /100 | #204 | Tragic 11.8% |
| Panamanians | 6.2 /100 | #205 | Tragic 11.9% |
| Immigrants | Eastern Africa | 5.4 /100 | #206 | Tragic 12.0% |
| Malaysians | 5.2 /100 | #207 | Tragic 12.0% |
| Immigrants | Immigrants | 4.5 /100 | #208 | Tragic 12.0% |
| Immigrants | Azores | 4.3 /100 | #209 | Tragic 12.0% |
| Moroccans | 4.2 /100 | #210 | Tragic 12.0% |
| Immigrants | Panama | 4.0 /100 | #211 | Tragic 12.1% |
| Americans | 3.2 /100 | #212 | Tragic 12.1% |
| Immigrants | Nonimmigrants | 3.1 /100 | #213 | Tragic 12.1% |
| Japanese | 2.7 /100 | #214 | Tragic 12.2% |
| Immigrants | Uzbekistan | 2.6 /100 | #215 | Tragic 12.2% |
| Immigrants | Cambodia | 2.5 /100 | #216 | Tragic 12.2% |
| Immigrants | Thailand | 2.5 /100 | #217 | Tragic 12.2% |
| German Russians | 2.5 /100 | #218 | Tragic 12.2% |
Demographics Similar to Pakistanis by Male Poverty
In terms of male poverty, the demographic groups most similar to Pakistanis are Immigrants from Vietnam (10.8%, a difference of 0.010%), New Zealander (10.8%, a difference of 0.010%), Brazilian (10.8%, a difference of 0.050%), Immigrants from Belarus (10.7%, a difference of 0.060%), and Chilean (10.7%, a difference of 0.17%).
| Demographics | Rating | Rank | Male Poverty |
| Immigrants | Ukraine | 84.3 /100 | #126 | Excellent 10.7% |
| Puget Sound Salish | 84.3 /100 | #127 | Excellent 10.7% |
| Immigrants | Western Europe | 84.2 /100 | #128 | Excellent 10.7% |
| Immigrants | Peru | 84.1 /100 | #129 | Excellent 10.7% |
| Chileans | 83.9 /100 | #130 | Excellent 10.7% |
| Immigrants | Belarus | 83.3 /100 | #131 | Excellent 10.7% |
| Immigrants | Vietnam | 83.0 /100 | #132 | Excellent 10.8% |
| Pakistanis | 83.0 /100 | #133 | Excellent 10.8% |
| New Zealanders | 82.9 /100 | #134 | Excellent 10.8% |
| Brazilians | 82.7 /100 | #135 | Excellent 10.8% |
| Immigrants | Israel | 80.9 /100 | #136 | Excellent 10.8% |
| Immigrants | Switzerland | 79.2 /100 | #137 | Good 10.8% |
| Yugoslavians | 78.2 /100 | #138 | Good 10.8% |
| Immigrants | Jordan | 77.5 /100 | #139 | Good 10.8% |
| Tlingit-Haida | 76.1 /100 | #140 | Good 10.9% |