Immigrants from Malaysia vs Latvian Receiving Food Stamps
COMPARE
Immigrants from Malaysia
Latvian
Receiving Food Stamps
Receiving Food Stamps Comparison
Immigrants from Malaysia
Latvians
10.4%
RECEIVING FOOD STAMPS
96.5/ 100
METRIC RATING
105th/ 347
METRIC RANK
9.1%
RECEIVING FOOD STAMPS
99.8/ 100
METRIC RATING
20th/ 347
METRIC RANK
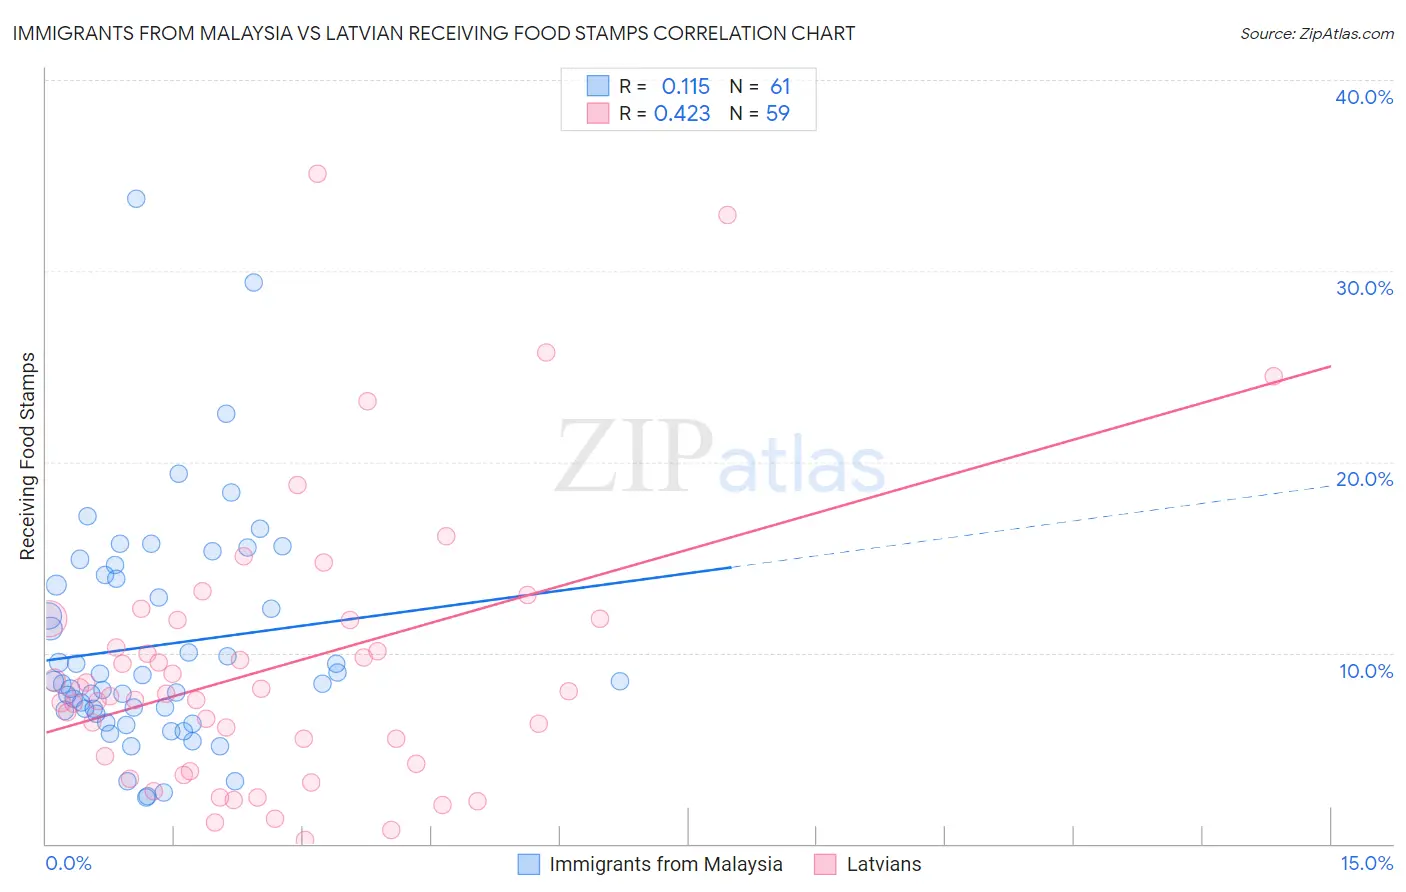
Immigrants from Malaysia vs Latvian Receiving Food Stamps Correlation Chart
The statistical analysis conducted on geographies consisting of 197,649,063 people shows a poor positive correlation between the proportion of Immigrants from Malaysia and percentage of population receiving government assistance and/or food stamps in the United States with a correlation coefficient (R) of 0.115 and weighted average of 10.4%. Similarly, the statistical analysis conducted on geographies consisting of 220,272,537 people shows a moderate positive correlation between the proportion of Latvians and percentage of population receiving government assistance and/or food stamps in the United States with a correlation coefficient (R) of 0.423 and weighted average of 9.1%, a difference of 13.8%.
Receiving Food Stamps Correlation Summary
| Measurement | Immigrants from Malaysia | Latvian |
| Minimum | 2.4% | 0.20% |
| Maximum | 33.8% | 35.1% |
| Range | 31.4% | 34.9% |
| Mean | 10.4% | 9.3% |
| Median | 8.5% | 7.9% |
| Interquartile 25% (IQ1) | 6.9% | 4.2% |
| Interquartile 75% (IQ3) | 14.0% | 11.7% |
| Interquartile Range (IQR) | 7.1% | 7.5% |
| Standard Deviation (Sample) | 6.0% | 7.2% |
| Standard Deviation (Population) | 5.9% | 7.2% |
Similar Demographics by Receiving Food Stamps
Demographics Similar to Immigrants from Malaysia by Receiving Food Stamps
In terms of receiving food stamps, the demographic groups most similar to Immigrants from Malaysia are Immigrants from Italy (10.4%, a difference of 0.090%), Korean (10.4%, a difference of 0.24%), Carpatho Rusyn (10.4%, a difference of 0.27%), Immigrants from Hungary (10.3%, a difference of 0.32%), and Immigrants from Pakistan (10.4%, a difference of 0.32%).
| Demographics | Rating | Rank | Receiving Food Stamps |
| Immigrants | Egypt | 97.1 /100 | #98 | Exceptional 10.3% |
| Serbians | 97.0 /100 | #99 | Exceptional 10.3% |
| Immigrants | Western Europe | 96.9 /100 | #100 | Exceptional 10.3% |
| Palestinians | 96.9 /100 | #101 | Exceptional 10.3% |
| Immigrants | Europe | 96.8 /100 | #102 | Exceptional 10.3% |
| Immigrants | Latvia | 96.8 /100 | #103 | Exceptional 10.3% |
| Immigrants | Hungary | 96.7 /100 | #104 | Exceptional 10.3% |
| Immigrants | Malaysia | 96.5 /100 | #105 | Exceptional 10.4% |
| Immigrants | Italy | 96.4 /100 | #106 | Exceptional 10.4% |
| Koreans | 96.3 /100 | #107 | Exceptional 10.4% |
| Carpatho Rusyns | 96.2 /100 | #108 | Exceptional 10.4% |
| Immigrants | Pakistan | 96.2 /100 | #109 | Exceptional 10.4% |
| Pakistanis | 95.9 /100 | #110 | Exceptional 10.4% |
| Romanians | 95.8 /100 | #111 | Exceptional 10.4% |
| Mongolians | 95.8 /100 | #112 | Exceptional 10.5% |
Demographics Similar to Latvians by Receiving Food Stamps
In terms of receiving food stamps, the demographic groups most similar to Latvians are Luxembourger (9.1%, a difference of 0.15%), Immigrants from Hong Kong (9.1%, a difference of 0.33%), Immigrants from Australia (9.2%, a difference of 0.40%), Eastern European (9.2%, a difference of 0.51%), and Immigrants from Northern Europe (9.2%, a difference of 0.54%).
| Demographics | Rating | Rank | Receiving Food Stamps |
| Bulgarians | 99.9 /100 | #13 | Exceptional 8.9% |
| Maltese | 99.9 /100 | #14 | Exceptional 8.9% |
| Norwegians | 99.9 /100 | #15 | Exceptional 9.0% |
| Immigrants | Japan | 99.9 /100 | #16 | Exceptional 9.0% |
| Immigrants | Scotland | 99.9 /100 | #17 | Exceptional 9.0% |
| Danes | 99.9 /100 | #18 | Exceptional 9.0% |
| Immigrants | Hong Kong | 99.8 /100 | #19 | Exceptional 9.1% |
| Latvians | 99.8 /100 | #20 | Exceptional 9.1% |
| Luxembourgers | 99.8 /100 | #21 | Exceptional 9.1% |
| Immigrants | Australia | 99.8 /100 | #22 | Exceptional 9.2% |
| Eastern Europeans | 99.8 /100 | #23 | Exceptional 9.2% |
| Immigrants | Northern Europe | 99.8 /100 | #24 | Exceptional 9.2% |
| Immigrants | Ireland | 99.8 /100 | #25 | Exceptional 9.2% |
| Swedes | 99.8 /100 | #26 | Exceptional 9.2% |
| Bhutanese | 99.8 /100 | #27 | Exceptional 9.2% |