Immigrants from Malaysia vs Slavic Receiving Food Stamps
COMPARE
Immigrants from Malaysia
Slavic
Receiving Food Stamps
Receiving Food Stamps Comparison
Immigrants from Malaysia
Slavs
10.4%
RECEIVING FOOD STAMPS
96.5/ 100
METRIC RATING
105th/ 347
METRIC RANK
10.6%
RECEIVING FOOD STAMPS
93.8/ 100
METRIC RATING
121st/ 347
METRIC RANK
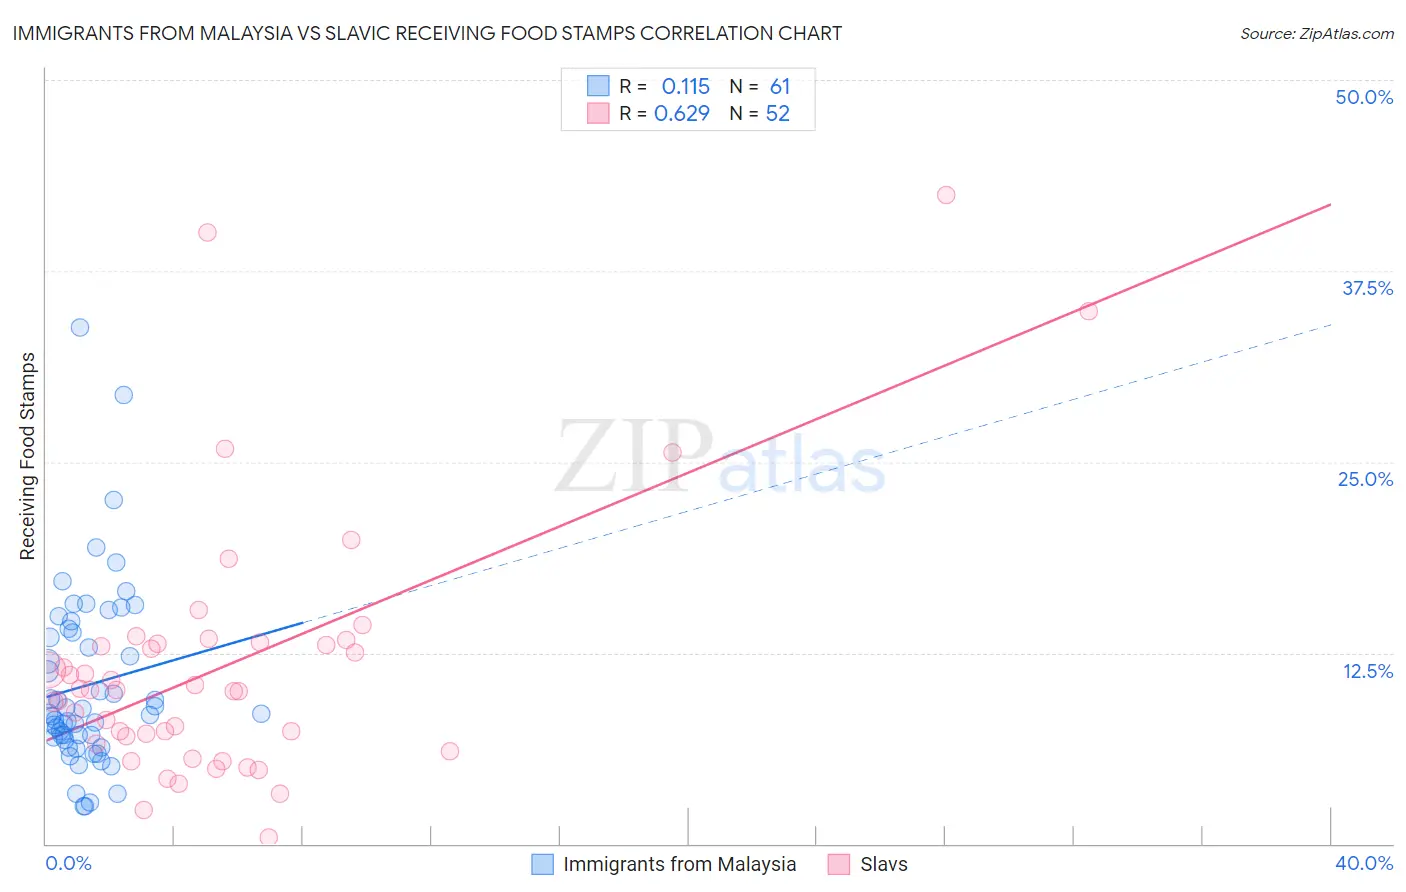
Immigrants from Malaysia vs Slavic Receiving Food Stamps Correlation Chart
The statistical analysis conducted on geographies consisting of 197,649,063 people shows a poor positive correlation between the proportion of Immigrants from Malaysia and percentage of population receiving government assistance and/or food stamps in the United States with a correlation coefficient (R) of 0.115 and weighted average of 10.4%. Similarly, the statistical analysis conducted on geographies consisting of 270,346,460 people shows a significant positive correlation between the proportion of Slavs and percentage of population receiving government assistance and/or food stamps in the United States with a correlation coefficient (R) of 0.629 and weighted average of 10.6%, a difference of 2.3%.
Receiving Food Stamps Correlation Summary
| Measurement | Immigrants from Malaysia | Slavic |
| Minimum | 2.4% | 0.40% |
| Maximum | 33.8% | 42.5% |
| Range | 31.4% | 42.1% |
| Mean | 10.4% | 11.7% |
| Median | 8.5% | 10.1% |
| Interquartile 25% (IQ1) | 6.9% | 6.8% |
| Interquartile 75% (IQ3) | 14.0% | 13.2% |
| Interquartile Range (IQR) | 7.1% | 6.4% |
| Standard Deviation (Sample) | 6.0% | 8.5% |
| Standard Deviation (Population) | 5.9% | 8.5% |
Demographics Similar to Immigrants from Malaysia and Slavs by Receiving Food Stamps
In terms of receiving food stamps, the demographic groups most similar to Immigrants from Malaysia are Immigrants from Italy (10.4%, a difference of 0.090%), Korean (10.4%, a difference of 0.24%), Carpatho Rusyn (10.4%, a difference of 0.27%), Immigrants from Hungary (10.3%, a difference of 0.32%), and Immigrants from Pakistan (10.4%, a difference of 0.32%). Similarly, the demographic groups most similar to Slavs are Immigrants from Poland (10.6%, a difference of 0.030%), Ethiopian (10.6%, a difference of 0.030%), Sri Lankan (10.6%, a difference of 0.070%), Assyrian/Chaldean/Syriac (10.6%, a difference of 0.20%), and Immigrants from Philippines (10.7%, a difference of 0.33%).
| Demographics | Rating | Rank | Receiving Food Stamps |
| Immigrants | Latvia | 96.8 /100 | #103 | Exceptional 10.3% |
| Immigrants | Hungary | 96.7 /100 | #104 | Exceptional 10.3% |
| Immigrants | Malaysia | 96.5 /100 | #105 | Exceptional 10.4% |
| Immigrants | Italy | 96.4 /100 | #106 | Exceptional 10.4% |
| Koreans | 96.3 /100 | #107 | Exceptional 10.4% |
| Carpatho Rusyns | 96.2 /100 | #108 | Exceptional 10.4% |
| Immigrants | Pakistan | 96.2 /100 | #109 | Exceptional 10.4% |
| Pakistanis | 95.9 /100 | #110 | Exceptional 10.4% |
| Romanians | 95.8 /100 | #111 | Exceptional 10.4% |
| Mongolians | 95.8 /100 | #112 | Exceptional 10.5% |
| Icelanders | 95.4 /100 | #113 | Exceptional 10.5% |
| Scotch-Irish | 95.1 /100 | #114 | Exceptional 10.5% |
| Immigrants | Saudi Arabia | 94.9 /100 | #115 | Exceptional 10.5% |
| Canadians | 94.8 /100 | #116 | Exceptional 10.5% |
| Immigrants | Nepal | 94.6 /100 | #117 | Exceptional 10.6% |
| Assyrians/Chaldeans/Syriacs | 94.1 /100 | #118 | Exceptional 10.6% |
| Immigrants | Poland | 93.9 /100 | #119 | Exceptional 10.6% |
| Ethiopians | 93.9 /100 | #120 | Exceptional 10.6% |
| Slavs | 93.8 /100 | #121 | Exceptional 10.6% |
| Sri Lankans | 93.7 /100 | #122 | Exceptional 10.6% |
| Immigrants | Philippines | 93.3 /100 | #123 | Exceptional 10.7% |