Arab vs Latvian Receiving Food Stamps
COMPARE
Arab
Latvian
Receiving Food Stamps
Receiving Food Stamps Comparison
Arabs
Latvians
11.5%
RECEIVING FOOD STAMPS
64.7/ 100
METRIC RATING
165th/ 347
METRIC RANK
9.1%
RECEIVING FOOD STAMPS
99.8/ 100
METRIC RATING
20th/ 347
METRIC RANK
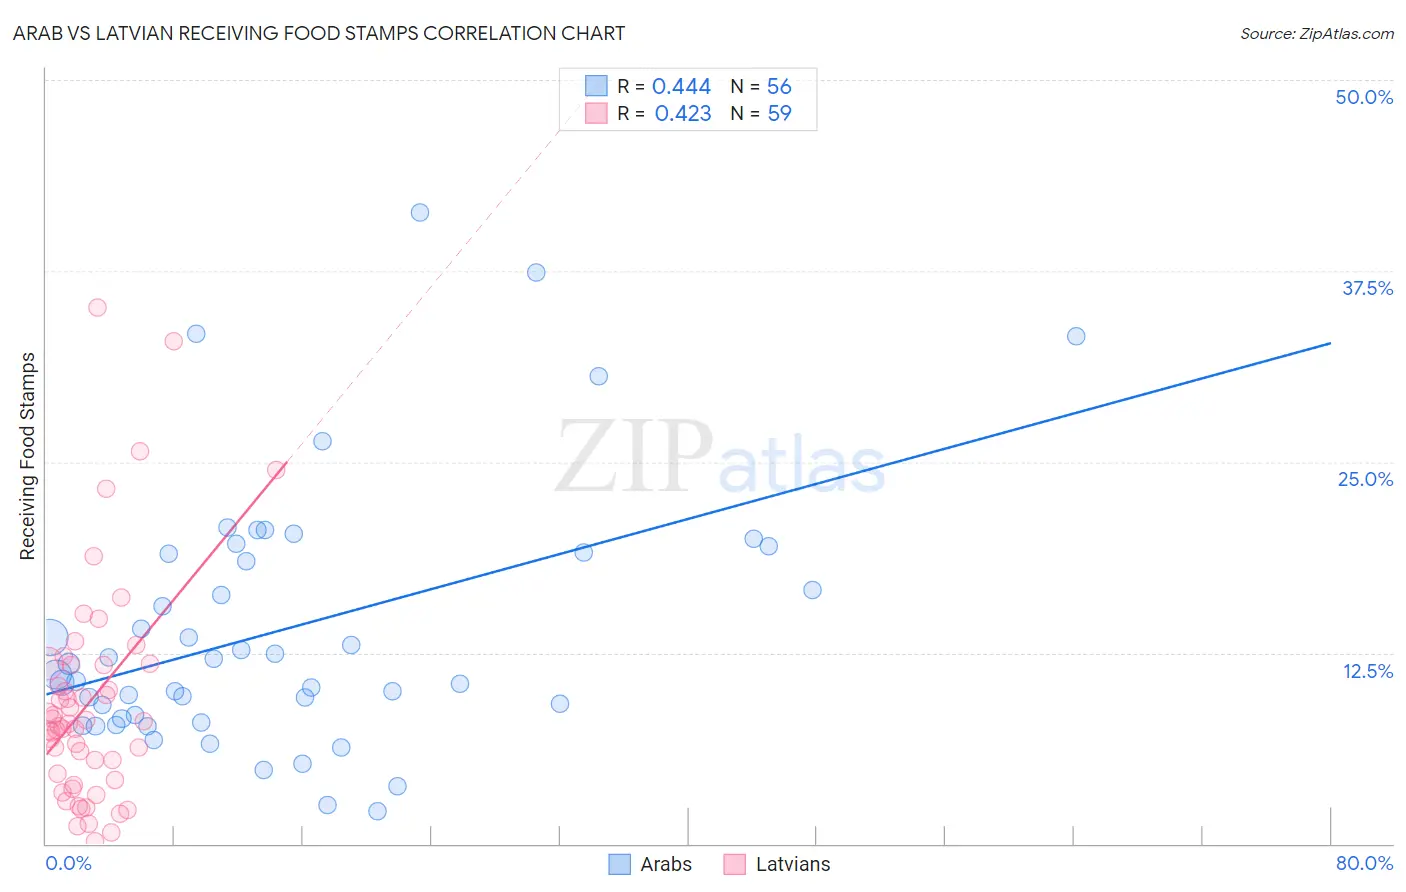
Arab vs Latvian Receiving Food Stamps Correlation Chart
The statistical analysis conducted on geographies consisting of 484,746,764 people shows a moderate positive correlation between the proportion of Arabs and percentage of population receiving government assistance and/or food stamps in the United States with a correlation coefficient (R) of 0.444 and weighted average of 11.5%. Similarly, the statistical analysis conducted on geographies consisting of 220,272,537 people shows a moderate positive correlation between the proportion of Latvians and percentage of population receiving government assistance and/or food stamps in the United States with a correlation coefficient (R) of 0.423 and weighted average of 9.1%, a difference of 26.0%.
Receiving Food Stamps Correlation Summary
| Measurement | Arab | Latvian |
| Minimum | 2.1% | 0.20% |
| Maximum | 41.3% | 35.1% |
| Range | 39.2% | 34.9% |
| Mean | 14.1% | 9.3% |
| Median | 11.4% | 7.9% |
| Interquartile 25% (IQ1) | 8.3% | 4.2% |
| Interquartile 75% (IQ3) | 19.0% | 11.7% |
| Interquartile Range (IQR) | 10.7% | 7.5% |
| Standard Deviation (Sample) | 8.5% | 7.2% |
| Standard Deviation (Population) | 8.5% | 7.2% |
Similar Demographics by Receiving Food Stamps
Demographics Similar to Arabs by Receiving Food Stamps
In terms of receiving food stamps, the demographic groups most similar to Arabs are Immigrants from Chile (11.5%, a difference of 0.050%), Immigrants from Southern Europe (11.5%, a difference of 0.17%), Immigrants from Belarus (11.5%, a difference of 0.30%), Alsatian (11.4%, a difference of 0.54%), and Pennsylvania German (11.4%, a difference of 0.60%).
| Demographics | Rating | Rank | Receiving Food Stamps |
| Immigrants | Bosnia and Herzegovina | 72.6 /100 | #158 | Good 11.3% |
| Immigrants | Oceania | 70.4 /100 | #159 | Good 11.4% |
| French Canadians | 69.5 /100 | #160 | Good 11.4% |
| Pennsylvania Germans | 68.4 /100 | #161 | Good 11.4% |
| Alsatians | 68.0 /100 | #162 | Good 11.4% |
| Immigrants | Southern Europe | 65.8 /100 | #163 | Good 11.5% |
| Immigrants | Chile | 65.0 /100 | #164 | Good 11.5% |
| Arabs | 64.7 /100 | #165 | Good 11.5% |
| Immigrants | Belarus | 62.8 /100 | #166 | Good 11.5% |
| Kenyans | 60.2 /100 | #167 | Good 11.6% |
| Tlingit-Haida | 59.1 /100 | #168 | Average 11.6% |
| Immigrants | Eastern Africa | 58.3 /100 | #169 | Average 11.6% |
| Costa Ricans | 57.9 /100 | #170 | Average 11.6% |
| Immigrants | Western Asia | 56.4 /100 | #171 | Average 11.6% |
| Guamanians/Chamorros | 54.2 /100 | #172 | Average 11.7% |
Demographics Similar to Latvians by Receiving Food Stamps
In terms of receiving food stamps, the demographic groups most similar to Latvians are Luxembourger (9.1%, a difference of 0.15%), Immigrants from Hong Kong (9.1%, a difference of 0.33%), Immigrants from Australia (9.2%, a difference of 0.40%), Eastern European (9.2%, a difference of 0.51%), and Immigrants from Northern Europe (9.2%, a difference of 0.54%).
| Demographics | Rating | Rank | Receiving Food Stamps |
| Bulgarians | 99.9 /100 | #13 | Exceptional 8.9% |
| Maltese | 99.9 /100 | #14 | Exceptional 8.9% |
| Norwegians | 99.9 /100 | #15 | Exceptional 9.0% |
| Immigrants | Japan | 99.9 /100 | #16 | Exceptional 9.0% |
| Immigrants | Scotland | 99.9 /100 | #17 | Exceptional 9.0% |
| Danes | 99.9 /100 | #18 | Exceptional 9.0% |
| Immigrants | Hong Kong | 99.8 /100 | #19 | Exceptional 9.1% |
| Latvians | 99.8 /100 | #20 | Exceptional 9.1% |
| Luxembourgers | 99.8 /100 | #21 | Exceptional 9.1% |
| Immigrants | Australia | 99.8 /100 | #22 | Exceptional 9.2% |
| Eastern Europeans | 99.8 /100 | #23 | Exceptional 9.2% |
| Immigrants | Northern Europe | 99.8 /100 | #24 | Exceptional 9.2% |
| Immigrants | Ireland | 99.8 /100 | #25 | Exceptional 9.2% |
| Swedes | 99.8 /100 | #26 | Exceptional 9.2% |
| Bhutanese | 99.8 /100 | #27 | Exceptional 9.2% |