Immigrants from Malaysia vs Guamanian/Chamorro Receiving Food Stamps
COMPARE
Immigrants from Malaysia
Guamanian/Chamorro
Receiving Food Stamps
Receiving Food Stamps Comparison
Immigrants from Malaysia
Guamanians/Chamorros
10.4%
RECEIVING FOOD STAMPS
96.5/ 100
METRIC RATING
105th/ 347
METRIC RANK
11.7%
RECEIVING FOOD STAMPS
54.2/ 100
METRIC RATING
172nd/ 347
METRIC RANK
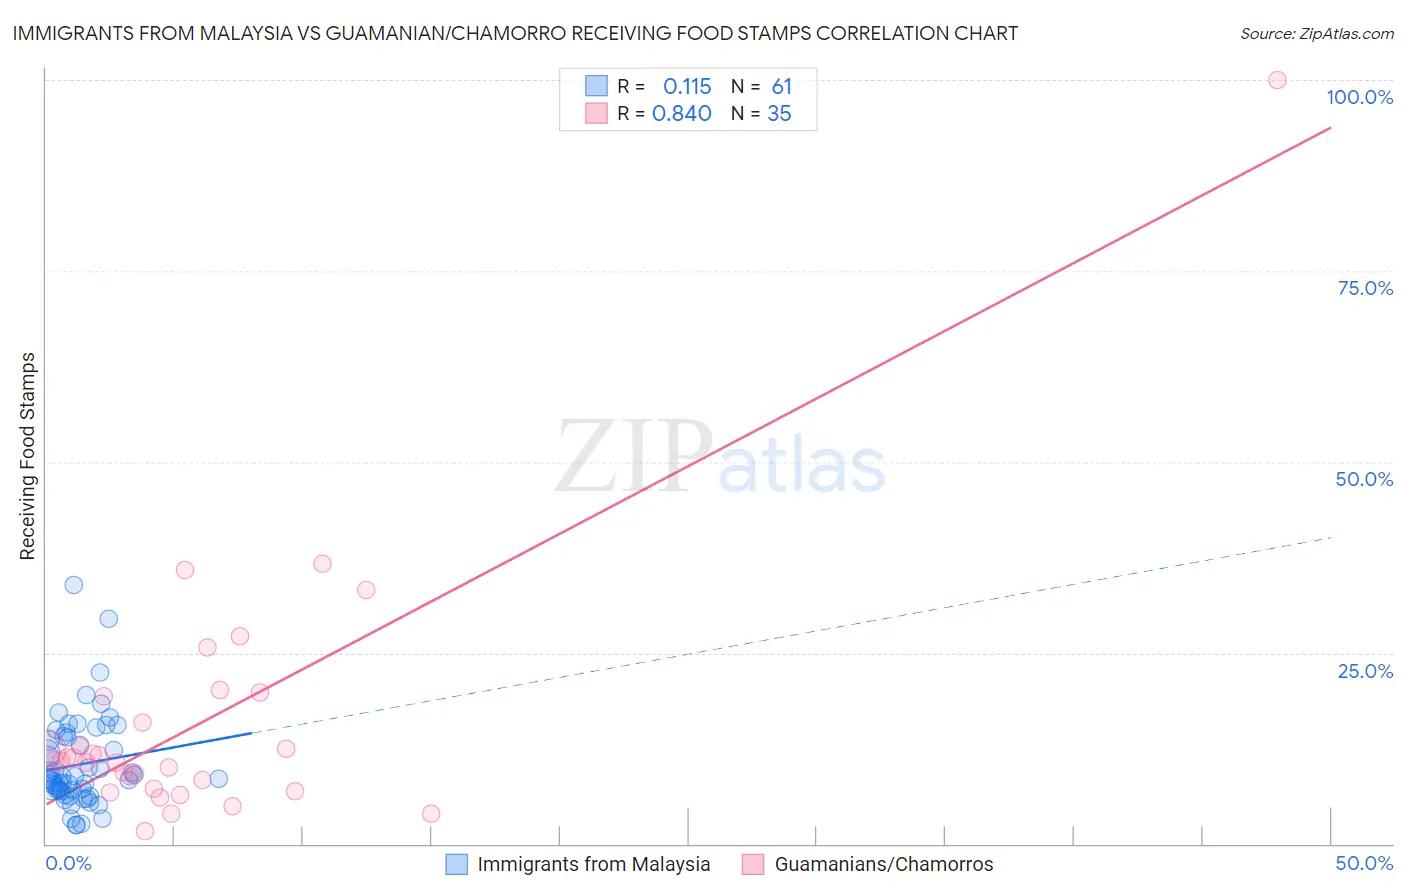
Immigrants from Malaysia vs Guamanian/Chamorro Receiving Food Stamps Correlation Chart
The statistical analysis conducted on geographies consisting of 197,649,063 people shows a poor positive correlation between the proportion of Immigrants from Malaysia and percentage of population receiving government assistance and/or food stamps in the United States with a correlation coefficient (R) of 0.115 and weighted average of 10.4%. Similarly, the statistical analysis conducted on geographies consisting of 221,700,710 people shows a very strong positive correlation between the proportion of Guamanians/Chamorros and percentage of population receiving government assistance and/or food stamps in the United States with a correlation coefficient (R) of 0.840 and weighted average of 11.7%, a difference of 12.4%.
Receiving Food Stamps Correlation Summary
| Measurement | Immigrants from Malaysia | Guamanian/Chamorro |
| Minimum | 2.4% | 1.7% |
| Maximum | 33.8% | 100.0% |
| Range | 31.4% | 98.3% |
| Mean | 10.4% | 15.8% |
| Median | 8.5% | 10.8% |
| Interquartile 25% (IQ1) | 6.9% | 7.3% |
| Interquartile 75% (IQ3) | 14.0% | 19.4% |
| Interquartile Range (IQR) | 7.1% | 12.1% |
| Standard Deviation (Sample) | 6.0% | 17.1% |
| Standard Deviation (Population) | 5.9% | 16.9% |
Similar Demographics by Receiving Food Stamps
Demographics Similar to Immigrants from Malaysia by Receiving Food Stamps
In terms of receiving food stamps, the demographic groups most similar to Immigrants from Malaysia are Immigrants from Italy (10.4%, a difference of 0.090%), Korean (10.4%, a difference of 0.24%), Carpatho Rusyn (10.4%, a difference of 0.27%), Immigrants from Hungary (10.3%, a difference of 0.32%), and Immigrants from Pakistan (10.4%, a difference of 0.32%).
| Demographics | Rating | Rank | Receiving Food Stamps |
| Immigrants | Egypt | 97.1 /100 | #98 | Exceptional 10.3% |
| Serbians | 97.0 /100 | #99 | Exceptional 10.3% |
| Immigrants | Western Europe | 96.9 /100 | #100 | Exceptional 10.3% |
| Palestinians | 96.9 /100 | #101 | Exceptional 10.3% |
| Immigrants | Europe | 96.8 /100 | #102 | Exceptional 10.3% |
| Immigrants | Latvia | 96.8 /100 | #103 | Exceptional 10.3% |
| Immigrants | Hungary | 96.7 /100 | #104 | Exceptional 10.3% |
| Immigrants | Malaysia | 96.5 /100 | #105 | Exceptional 10.4% |
| Immigrants | Italy | 96.4 /100 | #106 | Exceptional 10.4% |
| Koreans | 96.3 /100 | #107 | Exceptional 10.4% |
| Carpatho Rusyns | 96.2 /100 | #108 | Exceptional 10.4% |
| Immigrants | Pakistan | 96.2 /100 | #109 | Exceptional 10.4% |
| Pakistanis | 95.9 /100 | #110 | Exceptional 10.4% |
| Romanians | 95.8 /100 | #111 | Exceptional 10.4% |
| Mongolians | 95.8 /100 | #112 | Exceptional 10.5% |
Demographics Similar to Guamanians/Chamorros by Receiving Food Stamps
In terms of receiving food stamps, the demographic groups most similar to Guamanians/Chamorros are Immigrants from Syria (11.7%, a difference of 0.11%), Immigrants from Western Asia (11.6%, a difference of 0.32%), Costa Rican (11.6%, a difference of 0.53%), Immigrants from Eritrea (11.7%, a difference of 0.59%), and Immigrants from Eastern Africa (11.6%, a difference of 0.60%).
| Demographics | Rating | Rank | Receiving Food Stamps |
| Arabs | 64.7 /100 | #165 | Good 11.5% |
| Immigrants | Belarus | 62.8 /100 | #166 | Good 11.5% |
| Kenyans | 60.2 /100 | #167 | Good 11.6% |
| Tlingit-Haida | 59.1 /100 | #168 | Average 11.6% |
| Immigrants | Eastern Africa | 58.3 /100 | #169 | Average 11.6% |
| Costa Ricans | 57.9 /100 | #170 | Average 11.6% |
| Immigrants | Western Asia | 56.4 /100 | #171 | Average 11.6% |
| Guamanians/Chamorros | 54.2 /100 | #172 | Average 11.7% |
| Immigrants | Syria | 53.4 /100 | #173 | Average 11.7% |
| Immigrants | Eritrea | 50.0 /100 | #174 | Average 11.7% |
| Osage | 49.8 /100 | #175 | Average 11.7% |
| Peruvians | 49.3 /100 | #176 | Average 11.7% |
| Immigrants | Ukraine | 48.4 /100 | #177 | Average 11.8% |
| German Russians | 48.1 /100 | #178 | Average 11.8% |
| Immigrants | Kenya | 46.4 /100 | #179 | Average 11.8% |