Creek vs Latvian Receiving Food Stamps
COMPARE
Creek
Latvian
Receiving Food Stamps
Receiving Food Stamps Comparison
Creek
Latvians
14.1%
RECEIVING FOOD STAMPS
0.3/ 100
METRIC RATING
259th/ 347
METRIC RANK
9.1%
RECEIVING FOOD STAMPS
99.8/ 100
METRIC RATING
20th/ 347
METRIC RANK
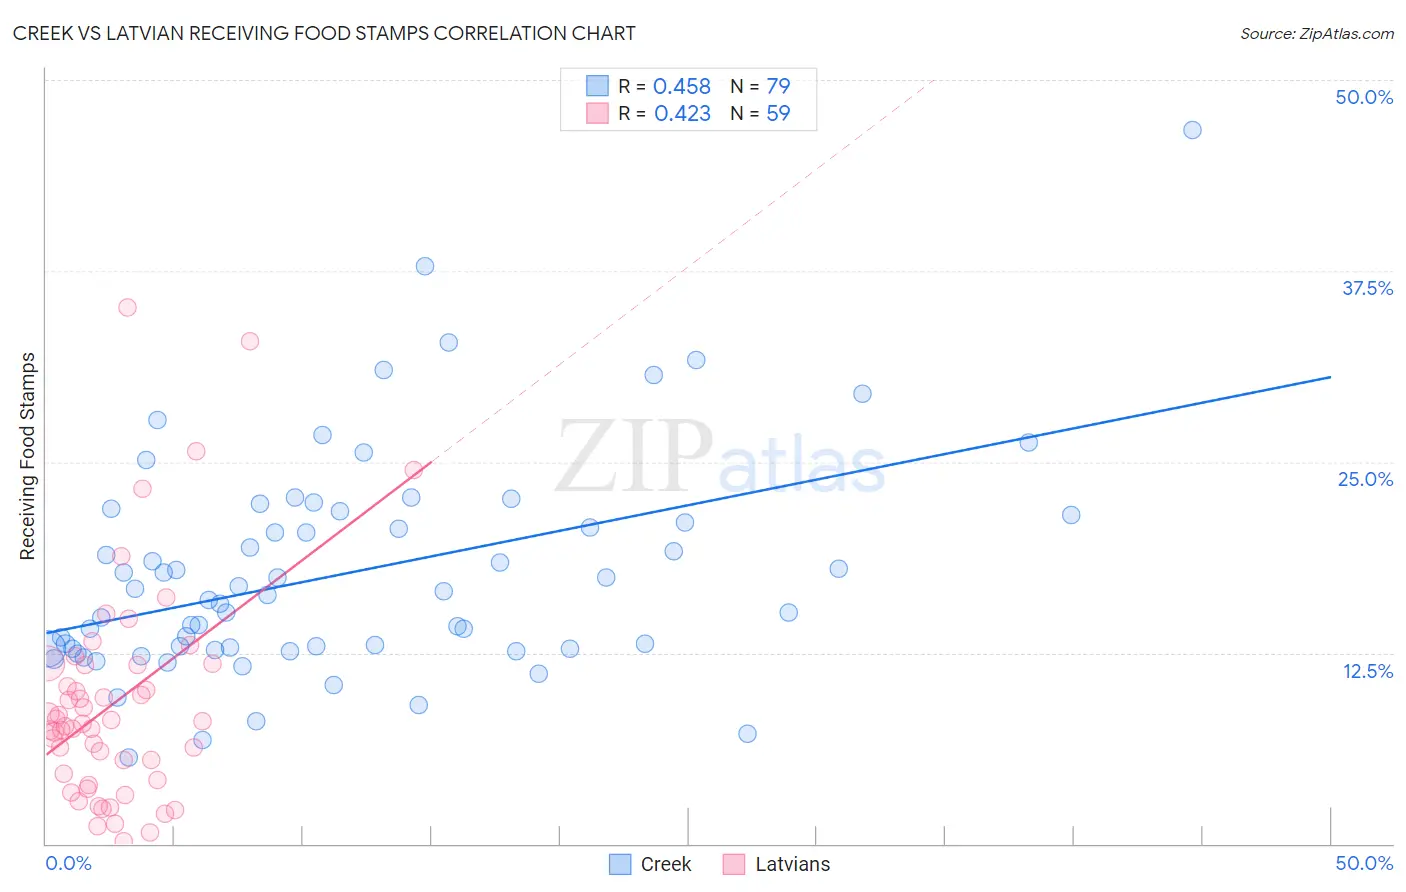
Creek vs Latvian Receiving Food Stamps Correlation Chart
The statistical analysis conducted on geographies consisting of 178,321,900 people shows a moderate positive correlation between the proportion of Creek and percentage of population receiving government assistance and/or food stamps in the United States with a correlation coefficient (R) of 0.458 and weighted average of 14.1%. Similarly, the statistical analysis conducted on geographies consisting of 220,272,537 people shows a moderate positive correlation between the proportion of Latvians and percentage of population receiving government assistance and/or food stamps in the United States with a correlation coefficient (R) of 0.423 and weighted average of 9.1%, a difference of 55.0%.
Receiving Food Stamps Correlation Summary
| Measurement | Creek | Latvian |
| Minimum | 5.6% | 0.20% |
| Maximum | 46.7% | 35.1% |
| Range | 41.1% | 34.9% |
| Mean | 17.7% | 9.3% |
| Median | 16.3% | 7.9% |
| Interquartile 25% (IQ1) | 12.8% | 4.2% |
| Interquartile 75% (IQ3) | 21.5% | 11.7% |
| Interquartile Range (IQR) | 8.7% | 7.5% |
| Standard Deviation (Sample) | 7.2% | 7.2% |
| Standard Deviation (Population) | 7.2% | 7.2% |
Similar Demographics by Receiving Food Stamps
Demographics Similar to Creek by Receiving Food Stamps
In terms of receiving food stamps, the demographic groups most similar to Creek are Central American (14.1%, a difference of 0.090%), Immigrants from Congo (14.1%, a difference of 0.11%), Immigrants from Ghana (14.1%, a difference of 0.12%), Arapaho (14.1%, a difference of 0.20%), and Japanese (14.1%, a difference of 0.30%).
| Demographics | Rating | Rank | Receiving Food Stamps |
| Ghanaians | 0.5 /100 | #252 | Tragic 14.0% |
| Spanish Americans | 0.4 /100 | #253 | Tragic 14.0% |
| Marshallese | 0.3 /100 | #254 | Tragic 14.1% |
| Sub-Saharan Africans | 0.3 /100 | #255 | Tragic 14.1% |
| Japanese | 0.3 /100 | #256 | Tragic 14.1% |
| Arapaho | 0.3 /100 | #257 | Tragic 14.1% |
| Immigrants | Ghana | 0.3 /100 | #258 | Tragic 14.1% |
| Creek | 0.3 /100 | #259 | Tragic 14.1% |
| Central Americans | 0.3 /100 | #260 | Tragic 14.1% |
| Immigrants | Congo | 0.3 /100 | #261 | Tragic 14.1% |
| Paiute | 0.2 /100 | #262 | Tragic 14.3% |
| Immigrants | Portugal | 0.2 /100 | #263 | Tragic 14.3% |
| Immigrants | Uzbekistan | 0.2 /100 | #264 | Tragic 14.3% |
| Blackfeet | 0.2 /100 | #265 | Tragic 14.3% |
| Cheyenne | 0.2 /100 | #266 | Tragic 14.3% |
Demographics Similar to Latvians by Receiving Food Stamps
In terms of receiving food stamps, the demographic groups most similar to Latvians are Luxembourger (9.1%, a difference of 0.15%), Immigrants from Hong Kong (9.1%, a difference of 0.33%), Immigrants from Australia (9.2%, a difference of 0.40%), Eastern European (9.2%, a difference of 0.51%), and Immigrants from Northern Europe (9.2%, a difference of 0.54%).
| Demographics | Rating | Rank | Receiving Food Stamps |
| Bulgarians | 99.9 /100 | #13 | Exceptional 8.9% |
| Maltese | 99.9 /100 | #14 | Exceptional 8.9% |
| Norwegians | 99.9 /100 | #15 | Exceptional 9.0% |
| Immigrants | Japan | 99.9 /100 | #16 | Exceptional 9.0% |
| Immigrants | Scotland | 99.9 /100 | #17 | Exceptional 9.0% |
| Danes | 99.9 /100 | #18 | Exceptional 9.0% |
| Immigrants | Hong Kong | 99.8 /100 | #19 | Exceptional 9.1% |
| Latvians | 99.8 /100 | #20 | Exceptional 9.1% |
| Luxembourgers | 99.8 /100 | #21 | Exceptional 9.1% |
| Immigrants | Australia | 99.8 /100 | #22 | Exceptional 9.2% |
| Eastern Europeans | 99.8 /100 | #23 | Exceptional 9.2% |
| Immigrants | Northern Europe | 99.8 /100 | #24 | Exceptional 9.2% |
| Immigrants | Ireland | 99.8 /100 | #25 | Exceptional 9.2% |
| Swedes | 99.8 /100 | #26 | Exceptional 9.2% |
| Bhutanese | 99.8 /100 | #27 | Exceptional 9.2% |