New Zealander vs Latvian Receiving Food Stamps
COMPARE
New Zealander
Latvian
Receiving Food Stamps
Receiving Food Stamps Comparison
New Zealanders
Latvians
9.9%
RECEIVING FOOD STAMPS
98.8/ 100
METRIC RATING
74th/ 347
METRIC RANK
9.1%
RECEIVING FOOD STAMPS
99.8/ 100
METRIC RATING
20th/ 347
METRIC RANK
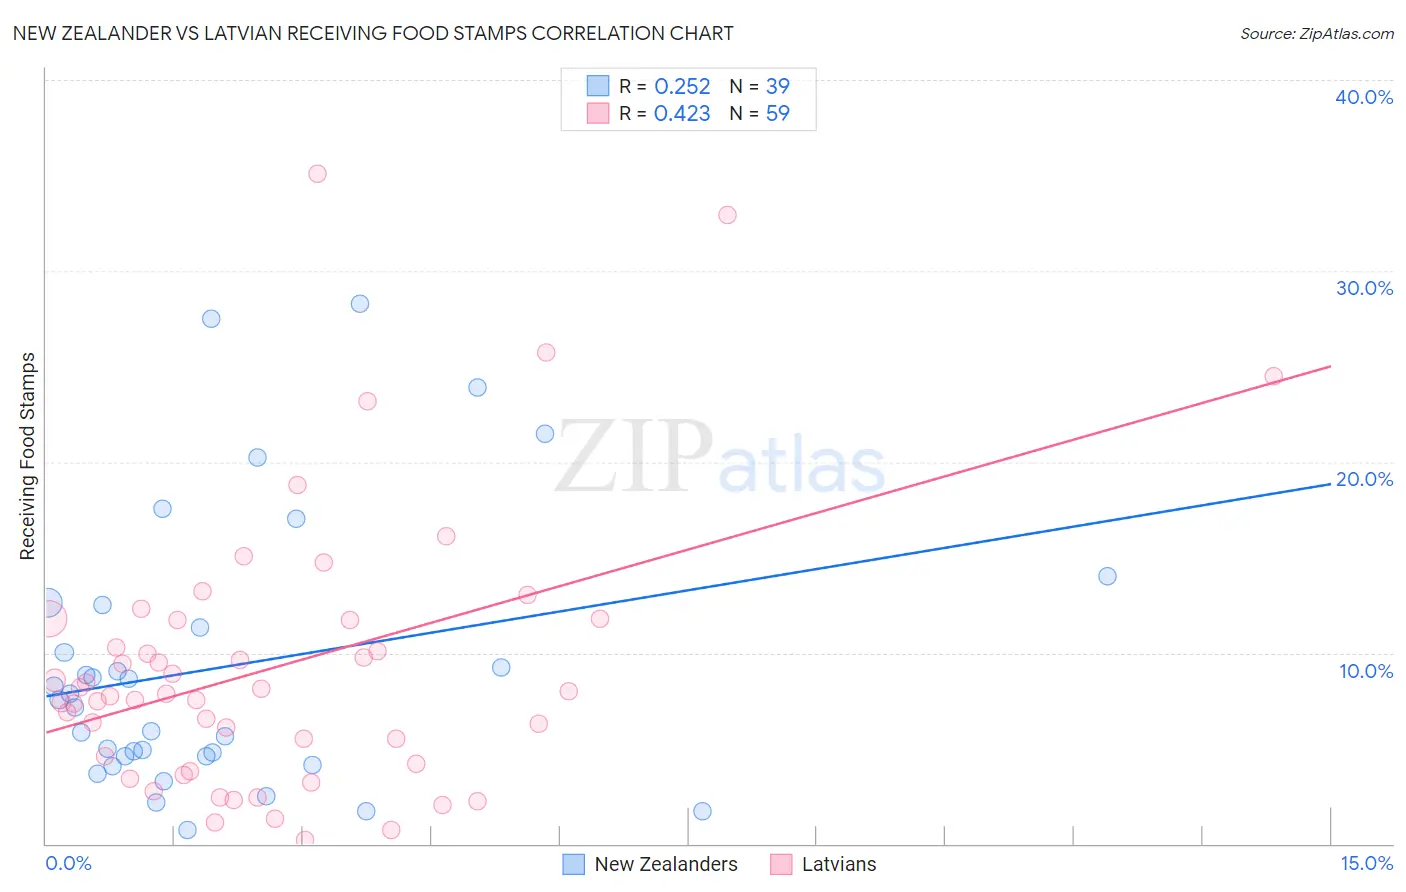
New Zealander vs Latvian Receiving Food Stamps Correlation Chart
The statistical analysis conducted on geographies consisting of 106,821,914 people shows a weak positive correlation between the proportion of New Zealanders and percentage of population receiving government assistance and/or food stamps in the United States with a correlation coefficient (R) of 0.252 and weighted average of 9.9%. Similarly, the statistical analysis conducted on geographies consisting of 220,272,537 people shows a moderate positive correlation between the proportion of Latvians and percentage of population receiving government assistance and/or food stamps in the United States with a correlation coefficient (R) of 0.423 and weighted average of 9.1%, a difference of 8.8%.
Receiving Food Stamps Correlation Summary
| Measurement | New Zealander | Latvian |
| Minimum | 0.70% | 0.20% |
| Maximum | 28.3% | 35.1% |
| Range | 27.6% | 34.9% |
| Mean | 9.3% | 9.3% |
| Median | 7.6% | 7.9% |
| Interquartile 25% (IQ1) | 4.6% | 4.2% |
| Interquartile 75% (IQ3) | 12.5% | 11.7% |
| Interquartile Range (IQR) | 7.9% | 7.5% |
| Standard Deviation (Sample) | 7.1% | 7.2% |
| Standard Deviation (Population) | 7.0% | 7.2% |
Similar Demographics by Receiving Food Stamps
Demographics Similar to New Zealanders by Receiving Food Stamps
In terms of receiving food stamps, the demographic groups most similar to New Zealanders are Macedonian (9.9%, a difference of 0.16%), Immigrants from Asia (9.9%, a difference of 0.23%), Immigrants from Zimbabwe (9.9%, a difference of 0.29%), Immigrants from Croatia (10.0%, a difference of 0.30%), and Immigrants from North Macedonia (10.0%, a difference of 0.39%).
| Demographics | Rating | Rank | Receiving Food Stamps |
| Immigrants | Indonesia | 99.0 /100 | #67 | Exceptional 9.8% |
| Northern Europeans | 99.0 /100 | #68 | Exceptional 9.8% |
| Italians | 99.0 /100 | #69 | Exceptional 9.9% |
| Immigrants | Serbia | 99.0 /100 | #70 | Exceptional 9.9% |
| Scottish | 98.9 /100 | #71 | Exceptional 9.9% |
| Immigrants | Asia | 98.9 /100 | #72 | Exceptional 9.9% |
| Macedonians | 98.9 /100 | #73 | Exceptional 9.9% |
| New Zealanders | 98.8 /100 | #74 | Exceptional 9.9% |
| Immigrants | Zimbabwe | 98.7 /100 | #75 | Exceptional 9.9% |
| Immigrants | Croatia | 98.7 /100 | #76 | Exceptional 10.0% |
| Immigrants | North Macedonia | 98.7 /100 | #77 | Exceptional 10.0% |
| South Africans | 98.7 /100 | #78 | Exceptional 10.0% |
| Laotians | 98.7 /100 | #79 | Exceptional 10.0% |
| Poles | 98.6 /100 | #80 | Exceptional 10.0% |
| Immigrants | England | 98.6 /100 | #81 | Exceptional 10.0% |
Demographics Similar to Latvians by Receiving Food Stamps
In terms of receiving food stamps, the demographic groups most similar to Latvians are Luxembourger (9.1%, a difference of 0.15%), Immigrants from Hong Kong (9.1%, a difference of 0.33%), Immigrants from Australia (9.2%, a difference of 0.40%), Eastern European (9.2%, a difference of 0.51%), and Immigrants from Northern Europe (9.2%, a difference of 0.54%).
| Demographics | Rating | Rank | Receiving Food Stamps |
| Bulgarians | 99.9 /100 | #13 | Exceptional 8.9% |
| Maltese | 99.9 /100 | #14 | Exceptional 8.9% |
| Norwegians | 99.9 /100 | #15 | Exceptional 9.0% |
| Immigrants | Japan | 99.9 /100 | #16 | Exceptional 9.0% |
| Immigrants | Scotland | 99.9 /100 | #17 | Exceptional 9.0% |
| Danes | 99.9 /100 | #18 | Exceptional 9.0% |
| Immigrants | Hong Kong | 99.8 /100 | #19 | Exceptional 9.1% |
| Latvians | 99.8 /100 | #20 | Exceptional 9.1% |
| Luxembourgers | 99.8 /100 | #21 | Exceptional 9.1% |
| Immigrants | Australia | 99.8 /100 | #22 | Exceptional 9.2% |
| Eastern Europeans | 99.8 /100 | #23 | Exceptional 9.2% |
| Immigrants | Northern Europe | 99.8 /100 | #24 | Exceptional 9.2% |
| Immigrants | Ireland | 99.8 /100 | #25 | Exceptional 9.2% |
| Swedes | 99.8 /100 | #26 | Exceptional 9.2% |
| Bhutanese | 99.8 /100 | #27 | Exceptional 9.2% |