Immigrants from Lithuania vs Immigrants from Colombia Single Female Poverty
COMPARE
Immigrants from Lithuania
Immigrants from Colombia
Single Female Poverty
Single Female Poverty Comparison
Immigrants from Lithuania
Immigrants from Colombia
17.8%
SINGLE FEMALE POVERTY
100.0/ 100
METRIC RATING
11th/ 347
METRIC RANK
20.0%
SINGLE FEMALE POVERTY
95.9/ 100
METRIC RATING
114th/ 347
METRIC RANK
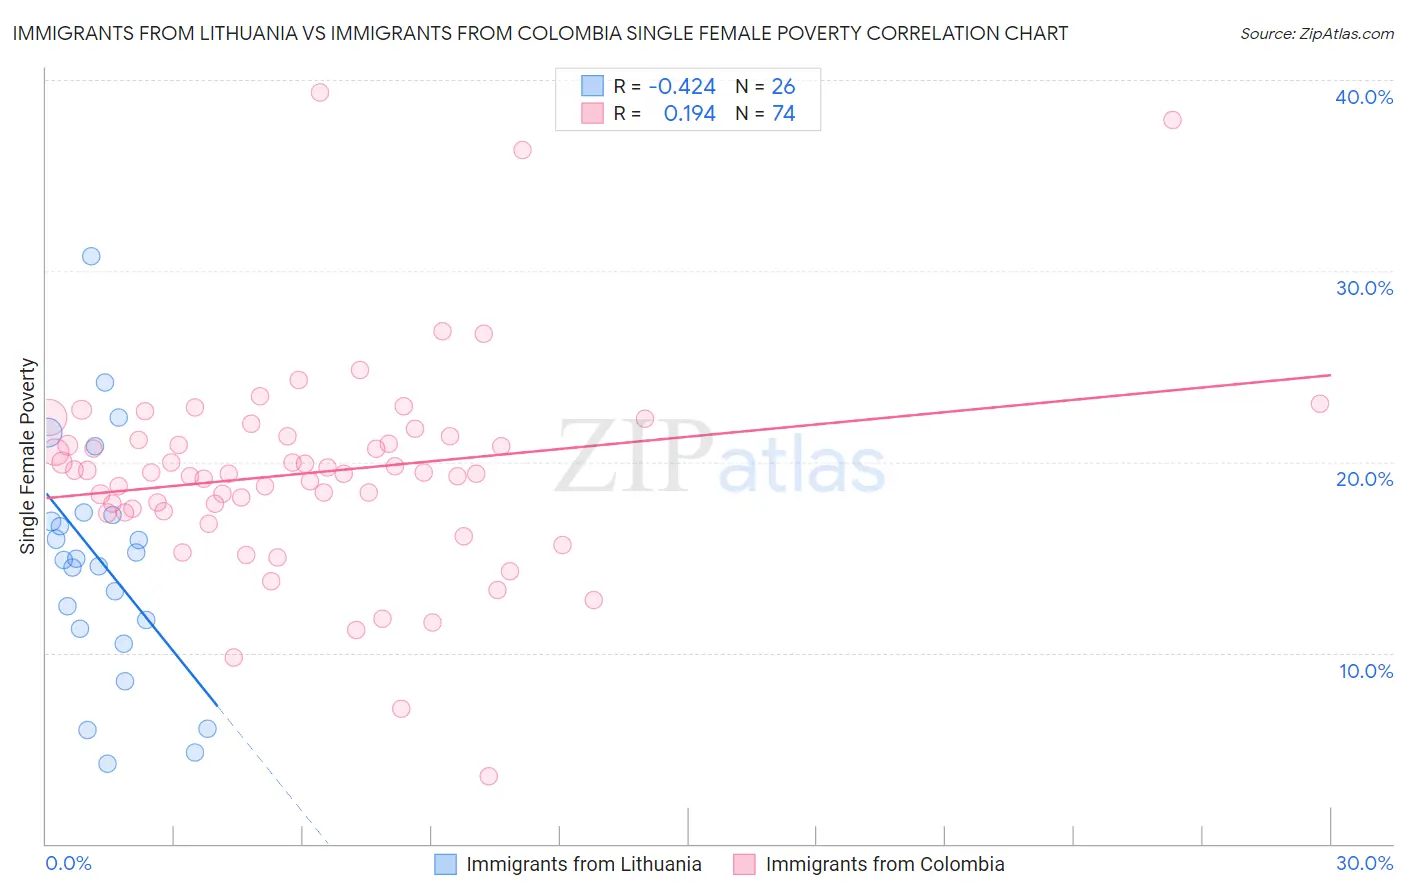
Immigrants from Lithuania vs Immigrants from Colombia Single Female Poverty Correlation Chart
The statistical analysis conducted on geographies consisting of 116,892,262 people shows a moderate negative correlation between the proportion of Immigrants from Lithuania and poverty level among single females in the United States with a correlation coefficient (R) of -0.424 and weighted average of 17.8%. Similarly, the statistical analysis conducted on geographies consisting of 373,438,404 people shows a poor positive correlation between the proportion of Immigrants from Colombia and poverty level among single females in the United States with a correlation coefficient (R) of 0.194 and weighted average of 20.0%, a difference of 12.3%.
Single Female Poverty Correlation Summary
| Measurement | Immigrants from Lithuania | Immigrants from Colombia |
| Minimum | 4.2% | 3.5% |
| Maximum | 30.7% | 39.4% |
| Range | 26.6% | 35.8% |
| Mean | 14.7% | 19.4% |
| Median | 14.9% | 19.4% |
| Interquartile 25% (IQ1) | 11.3% | 17.4% |
| Interquartile 75% (IQ3) | 17.2% | 21.3% |
| Interquartile Range (IQR) | 6.0% | 3.9% |
| Standard Deviation (Sample) | 6.2% | 5.6% |
| Standard Deviation (Population) | 6.1% | 5.5% |
Similar Demographics by Single Female Poverty
Demographics Similar to Immigrants from Lithuania by Single Female Poverty
In terms of single female poverty, the demographic groups most similar to Immigrants from Lithuania are Immigrants from South Central Asia (17.8%, a difference of 0.060%), Immigrants from Ireland (17.8%, a difference of 0.090%), Immigrants from Bolivia (17.8%, a difference of 0.32%), Bhutanese (17.7%, a difference of 0.50%), and Bolivian (17.9%, a difference of 0.76%).
| Demographics | Rating | Rank | Single Female Poverty |
| Immigrants | India | 100.0 /100 | #4 | Exceptional 16.8% |
| Assyrians/Chaldeans/Syriacs | 100.0 /100 | #5 | Exceptional 17.0% |
| Filipinos | 100.0 /100 | #6 | Exceptional 17.0% |
| Thais | 100.0 /100 | #7 | Exceptional 17.3% |
| Immigrants | Iran | 100.0 /100 | #8 | Exceptional 17.5% |
| Bhutanese | 100.0 /100 | #9 | Exceptional 17.7% |
| Immigrants | Ireland | 100.0 /100 | #10 | Exceptional 17.8% |
| Immigrants | Lithuania | 100.0 /100 | #11 | Exceptional 17.8% |
| Immigrants | South Central Asia | 100.0 /100 | #12 | Exceptional 17.8% |
| Immigrants | Bolivia | 100.0 /100 | #13 | Exceptional 17.8% |
| Bolivians | 100.0 /100 | #14 | Exceptional 17.9% |
| Indians (Asian) | 100.0 /100 | #15 | Exceptional 17.9% |
| Iranians | 100.0 /100 | #16 | Exceptional 18.0% |
| Immigrants | Korea | 100.0 /100 | #17 | Exceptional 18.1% |
| Immigrants | Eastern Asia | 100.0 /100 | #18 | Exceptional 18.1% |
Demographics Similar to Immigrants from Colombia by Single Female Poverty
In terms of single female poverty, the demographic groups most similar to Immigrants from Colombia are Immigrants from Zimbabwe (20.0%, a difference of 0.0%), Immigrants from Northern Africa (20.0%, a difference of 0.010%), Immigrants from Kazakhstan (20.0%, a difference of 0.050%), Immigrants from Netherlands (20.0%, a difference of 0.060%), and Polish (20.0%, a difference of 0.10%).
| Demographics | Rating | Rank | Single Female Poverty |
| Immigrants | Syria | 96.7 /100 | #107 | Exceptional 19.9% |
| Native Hawaiians | 96.6 /100 | #108 | Exceptional 19.9% |
| Colombians | 96.6 /100 | #109 | Exceptional 19.9% |
| Immigrants | Western Asia | 96.5 /100 | #110 | Exceptional 19.9% |
| Carpatho Rusyns | 96.1 /100 | #111 | Exceptional 20.0% |
| Immigrants | Netherlands | 96.0 /100 | #112 | Exceptional 20.0% |
| Immigrants | Zimbabwe | 95.9 /100 | #113 | Exceptional 20.0% |
| Immigrants | Colombia | 95.9 /100 | #114 | Exceptional 20.0% |
| Immigrants | Northern Africa | 95.8 /100 | #115 | Exceptional 20.0% |
| Immigrants | Kazakhstan | 95.7 /100 | #116 | Exceptional 20.0% |
| Poles | 95.6 /100 | #117 | Exceptional 20.0% |
| Immigrants | Afghanistan | 95.4 /100 | #118 | Exceptional 20.0% |
| Immigrants | Ethiopia | 95.4 /100 | #119 | Exceptional 20.0% |
| South Americans | 95.1 /100 | #120 | Exceptional 20.0% |
| Immigrants | Switzerland | 95.1 /100 | #121 | Exceptional 20.0% |