Immigrants from Lithuania vs Immigrants from Turkey Single Female Poverty
COMPARE
Immigrants from Lithuania
Immigrants from Turkey
Single Female Poverty
Single Female Poverty Comparison
Immigrants from Lithuania
Immigrants from Turkey
17.8%
SINGLE FEMALE POVERTY
100.0/ 100
METRIC RATING
11th/ 347
METRIC RANK
19.4%
SINGLE FEMALE POVERTY
99.4/ 100
METRIC RATING
75th/ 347
METRIC RANK
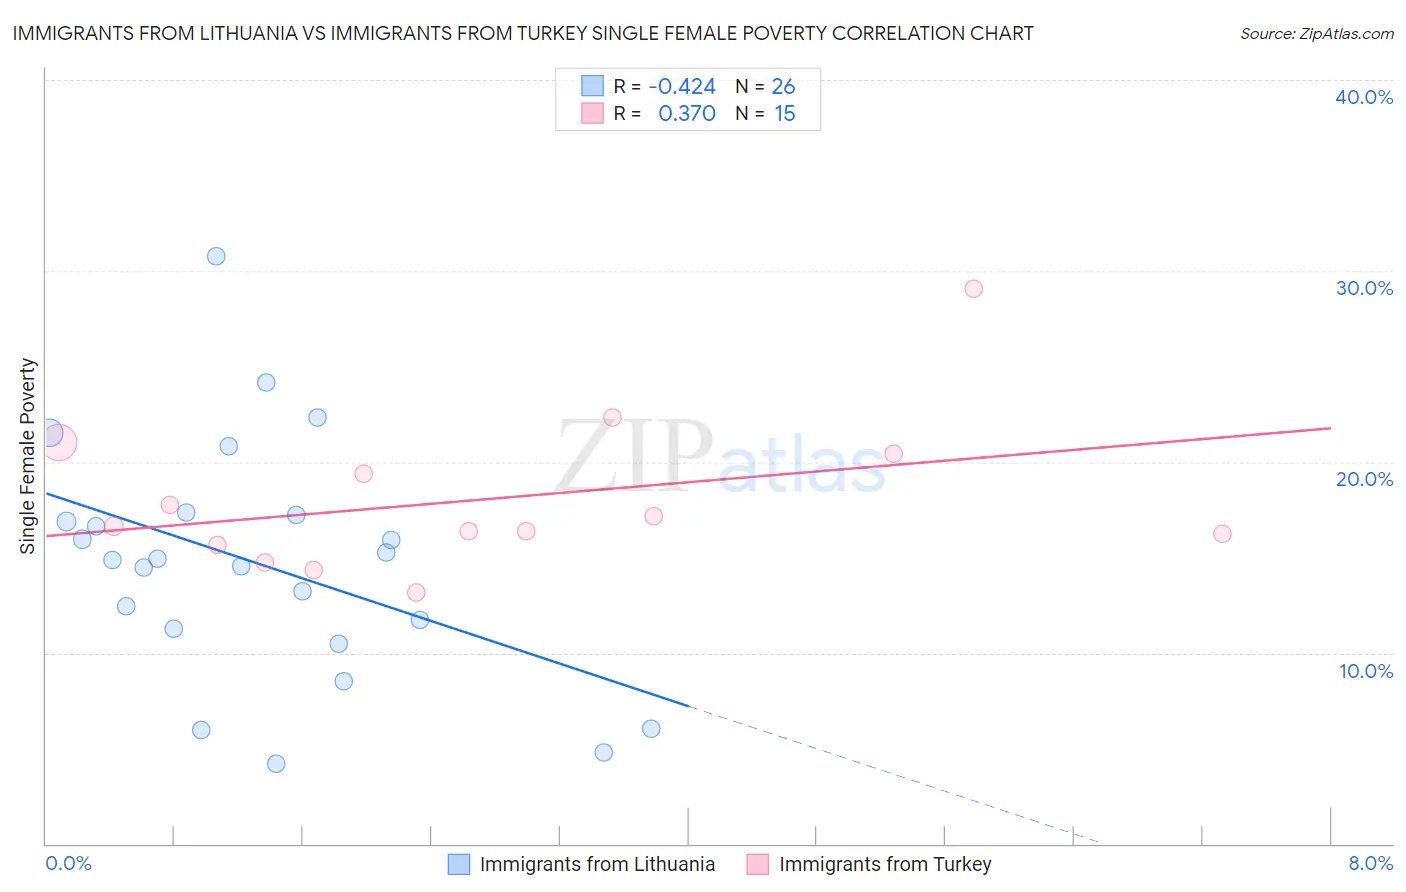
Immigrants from Lithuania vs Immigrants from Turkey Single Female Poverty Correlation Chart
The statistical analysis conducted on geographies consisting of 116,892,262 people shows a moderate negative correlation between the proportion of Immigrants from Lithuania and poverty level among single females in the United States with a correlation coefficient (R) of -0.424 and weighted average of 17.8%. Similarly, the statistical analysis conducted on geographies consisting of 220,264,730 people shows a mild positive correlation between the proportion of Immigrants from Turkey and poverty level among single females in the United States with a correlation coefficient (R) of 0.370 and weighted average of 19.4%, a difference of 8.8%.
Single Female Poverty Correlation Summary
| Measurement | Immigrants from Lithuania | Immigrants from Turkey |
| Minimum | 4.2% | 13.1% |
| Maximum | 30.7% | 29.1% |
| Range | 26.6% | 15.9% |
| Mean | 14.7% | 18.0% |
| Median | 14.9% | 16.6% |
| Interquartile 25% (IQ1) | 11.3% | 15.7% |
| Interquartile 75% (IQ3) | 17.2% | 20.5% |
| Interquartile Range (IQR) | 6.0% | 4.8% |
| Standard Deviation (Sample) | 6.2% | 4.0% |
| Standard Deviation (Population) | 6.1% | 3.9% |
Similar Demographics by Single Female Poverty
Demographics Similar to Immigrants from Lithuania by Single Female Poverty
In terms of single female poverty, the demographic groups most similar to Immigrants from Lithuania are Immigrants from South Central Asia (17.8%, a difference of 0.060%), Immigrants from Ireland (17.8%, a difference of 0.090%), Immigrants from Bolivia (17.8%, a difference of 0.32%), Bhutanese (17.7%, a difference of 0.50%), and Bolivian (17.9%, a difference of 0.76%).
| Demographics | Rating | Rank | Single Female Poverty |
| Immigrants | India | 100.0 /100 | #4 | Exceptional 16.8% |
| Assyrians/Chaldeans/Syriacs | 100.0 /100 | #5 | Exceptional 17.0% |
| Filipinos | 100.0 /100 | #6 | Exceptional 17.0% |
| Thais | 100.0 /100 | #7 | Exceptional 17.3% |
| Immigrants | Iran | 100.0 /100 | #8 | Exceptional 17.5% |
| Bhutanese | 100.0 /100 | #9 | Exceptional 17.7% |
| Immigrants | Ireland | 100.0 /100 | #10 | Exceptional 17.8% |
| Immigrants | Lithuania | 100.0 /100 | #11 | Exceptional 17.8% |
| Immigrants | South Central Asia | 100.0 /100 | #12 | Exceptional 17.8% |
| Immigrants | Bolivia | 100.0 /100 | #13 | Exceptional 17.8% |
| Bolivians | 100.0 /100 | #14 | Exceptional 17.9% |
| Indians (Asian) | 100.0 /100 | #15 | Exceptional 17.9% |
| Iranians | 100.0 /100 | #16 | Exceptional 18.0% |
| Immigrants | Korea | 100.0 /100 | #17 | Exceptional 18.1% |
| Immigrants | Eastern Asia | 100.0 /100 | #18 | Exceptional 18.1% |
Demographics Similar to Immigrants from Turkey by Single Female Poverty
In terms of single female poverty, the demographic groups most similar to Immigrants from Turkey are Immigrants from Belarus (19.3%, a difference of 0.040%), Peruvian (19.4%, a difference of 0.040%), Immigrants from Peru (19.3%, a difference of 0.050%), Immigrants from South Eastern Asia (19.3%, a difference of 0.15%), and Immigrants from Latvia (19.3%, a difference of 0.15%).
| Demographics | Rating | Rank | Single Female Poverty |
| Laotians | 99.5 /100 | #68 | Exceptional 19.3% |
| Paraguayans | 99.5 /100 | #69 | Exceptional 19.3% |
| Immigrants | Jordan | 99.4 /100 | #70 | Exceptional 19.3% |
| Immigrants | South Eastern Asia | 99.4 /100 | #71 | Exceptional 19.3% |
| Immigrants | Latvia | 99.4 /100 | #72 | Exceptional 19.3% |
| Immigrants | Peru | 99.4 /100 | #73 | Exceptional 19.3% |
| Immigrants | Belarus | 99.4 /100 | #74 | Exceptional 19.3% |
| Immigrants | Turkey | 99.4 /100 | #75 | Exceptional 19.4% |
| Peruvians | 99.4 /100 | #76 | Exceptional 19.4% |
| Immigrants | Russia | 99.3 /100 | #77 | Exceptional 19.4% |
| Albanians | 99.3 /100 | #78 | Exceptional 19.4% |
| Immigrants | Sierra Leone | 99.3 /100 | #79 | Exceptional 19.4% |
| Immigrants | Australia | 99.3 /100 | #80 | Exceptional 19.4% |
| Immigrants | Scotland | 99.2 /100 | #81 | Exceptional 19.4% |
| Immigrants | Malaysia | 99.2 /100 | #82 | Exceptional 19.4% |