Immigrants from Lithuania vs Immigrants from Bulgaria Poverty
COMPARE
Immigrants from Lithuania
Immigrants from Bulgaria
Poverty
Poverty Comparison
Immigrants from Lithuania
Immigrants from Bulgaria
10.3%
POVERTY
99.9/ 100
METRIC RATING
11th/ 347
METRIC RANK
11.1%
POVERTY
98.5/ 100
METRIC RATING
54th/ 347
METRIC RANK
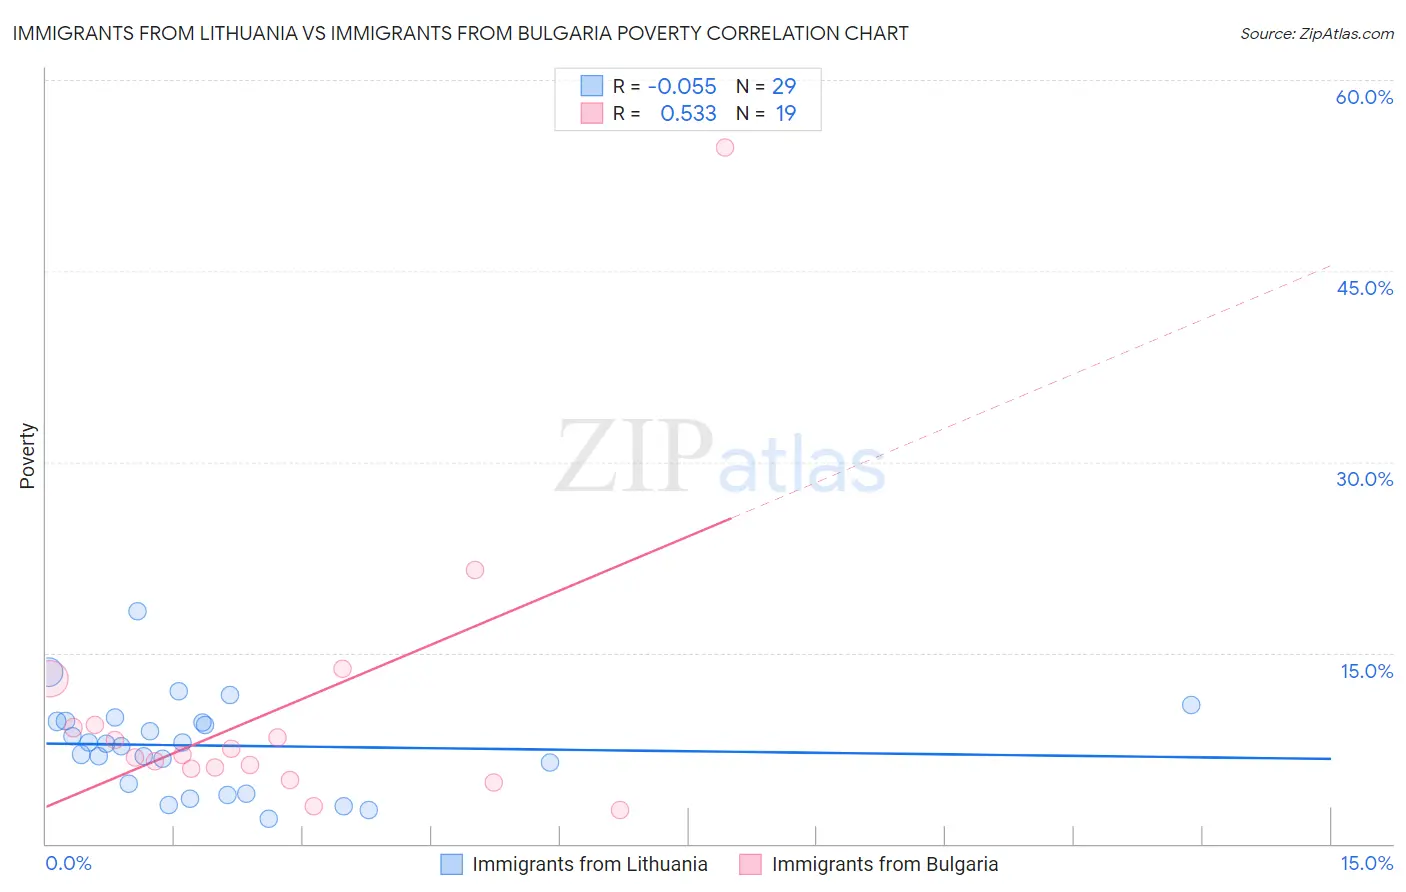
Immigrants from Lithuania vs Immigrants from Bulgaria Poverty Correlation Chart
The statistical analysis conducted on geographies consisting of 117,712,051 people shows a slight negative correlation between the proportion of Immigrants from Lithuania and poverty level in the United States with a correlation coefficient (R) of -0.055 and weighted average of 10.3%. Similarly, the statistical analysis conducted on geographies consisting of 172,536,486 people shows a substantial positive correlation between the proportion of Immigrants from Bulgaria and poverty level in the United States with a correlation coefficient (R) of 0.533 and weighted average of 11.1%, a difference of 7.0%.
Poverty Correlation Summary
| Measurement | Immigrants from Lithuania | Immigrants from Bulgaria |
| Minimum | 2.0% | 2.7% |
| Maximum | 18.3% | 54.7% |
| Range | 16.4% | 52.0% |
| Mean | 7.7% | 10.5% |
| Median | 7.9% | 7.0% |
| Interquartile 25% (IQ1) | 4.3% | 5.8% |
| Interquartile 75% (IQ3) | 9.6% | 9.4% |
| Interquartile Range (IQR) | 5.3% | 3.5% |
| Standard Deviation (Sample) | 3.7% | 11.5% |
| Standard Deviation (Population) | 3.6% | 11.2% |
Similar Demographics by Poverty
Demographics Similar to Immigrants from Lithuania by Poverty
In terms of poverty, the demographic groups most similar to Immigrants from Lithuania are Bhutanese (10.4%, a difference of 0.35%), Immigrants from Hong Kong (10.4%, a difference of 0.57%), Immigrants from Bolivia (10.4%, a difference of 0.89%), Bolivian (10.4%, a difference of 0.89%), and Bulgarian (10.2%, a difference of 0.99%).
| Demographics | Rating | Rank | Poverty |
| Immigrants | Taiwan | 100.0 /100 | #4 | Exceptional 9.7% |
| Immigrants | Ireland | 99.9 /100 | #5 | Exceptional 10.1% |
| Assyrians/Chaldeans/Syriacs | 99.9 /100 | #6 | Exceptional 10.1% |
| Filipinos | 99.9 /100 | #7 | Exceptional 10.1% |
| Maltese | 99.9 /100 | #8 | Exceptional 10.2% |
| Immigrants | South Central Asia | 99.9 /100 | #9 | Exceptional 10.2% |
| Bulgarians | 99.9 /100 | #10 | Exceptional 10.2% |
| Immigrants | Lithuania | 99.9 /100 | #11 | Exceptional 10.3% |
| Bhutanese | 99.8 /100 | #12 | Exceptional 10.4% |
| Immigrants | Hong Kong | 99.8 /100 | #13 | Exceptional 10.4% |
| Immigrants | Bolivia | 99.8 /100 | #14 | Exceptional 10.4% |
| Bolivians | 99.8 /100 | #15 | Exceptional 10.4% |
| Lithuanians | 99.8 /100 | #16 | Exceptional 10.5% |
| Norwegians | 99.8 /100 | #17 | Exceptional 10.5% |
| Latvians | 99.8 /100 | #18 | Exceptional 10.5% |
Demographics Similar to Immigrants from Bulgaria by Poverty
In terms of poverty, the demographic groups most similar to Immigrants from Bulgaria are Immigrants from Serbia (11.1%, a difference of 0.030%), Immigrants from Austria (11.1%, a difference of 0.12%), Immigrants from Philippines (11.0%, a difference of 0.34%), Immigrants from Croatia (11.0%, a difference of 0.36%), and Estonian (11.1%, a difference of 0.51%).
| Demographics | Rating | Rank | Poverty |
| Immigrants | Romania | 98.9 /100 | #47 | Exceptional 11.0% |
| Slovenes | 98.9 /100 | #48 | Exceptional 11.0% |
| Immigrants | Japan | 98.9 /100 | #49 | Exceptional 11.0% |
| Asians | 98.9 /100 | #50 | Exceptional 11.0% |
| Immigrants | Croatia | 98.7 /100 | #51 | Exceptional 11.0% |
| Immigrants | Philippines | 98.7 /100 | #52 | Exceptional 11.0% |
| Immigrants | Austria | 98.6 /100 | #53 | Exceptional 11.1% |
| Immigrants | Bulgaria | 98.5 /100 | #54 | Exceptional 11.1% |
| Immigrants | Serbia | 98.5 /100 | #55 | Exceptional 11.1% |
| Estonians | 98.2 /100 | #56 | Exceptional 11.1% |
| Scandinavians | 98.2 /100 | #57 | Exceptional 11.1% |
| Germans | 98.1 /100 | #58 | Exceptional 11.1% |
| Immigrants | Europe | 98.0 /100 | #59 | Exceptional 11.2% |
| Immigrants | Sri Lanka | 97.9 /100 | #60 | Exceptional 11.2% |
| Immigrants | Italy | 97.9 /100 | #61 | Exceptional 11.2% |