Immigrants from Lithuania vs Carpatho Rusyn Poverty
COMPARE
Immigrants from Lithuania
Carpatho Rusyn
Poverty
Poverty Comparison
Immigrants from Lithuania
Carpatho Rusyns
10.3%
POVERTY
99.9/ 100
METRIC RATING
11th/ 347
METRIC RANK
11.3%
POVERTY
97.2/ 100
METRIC RATING
74th/ 347
METRIC RANK
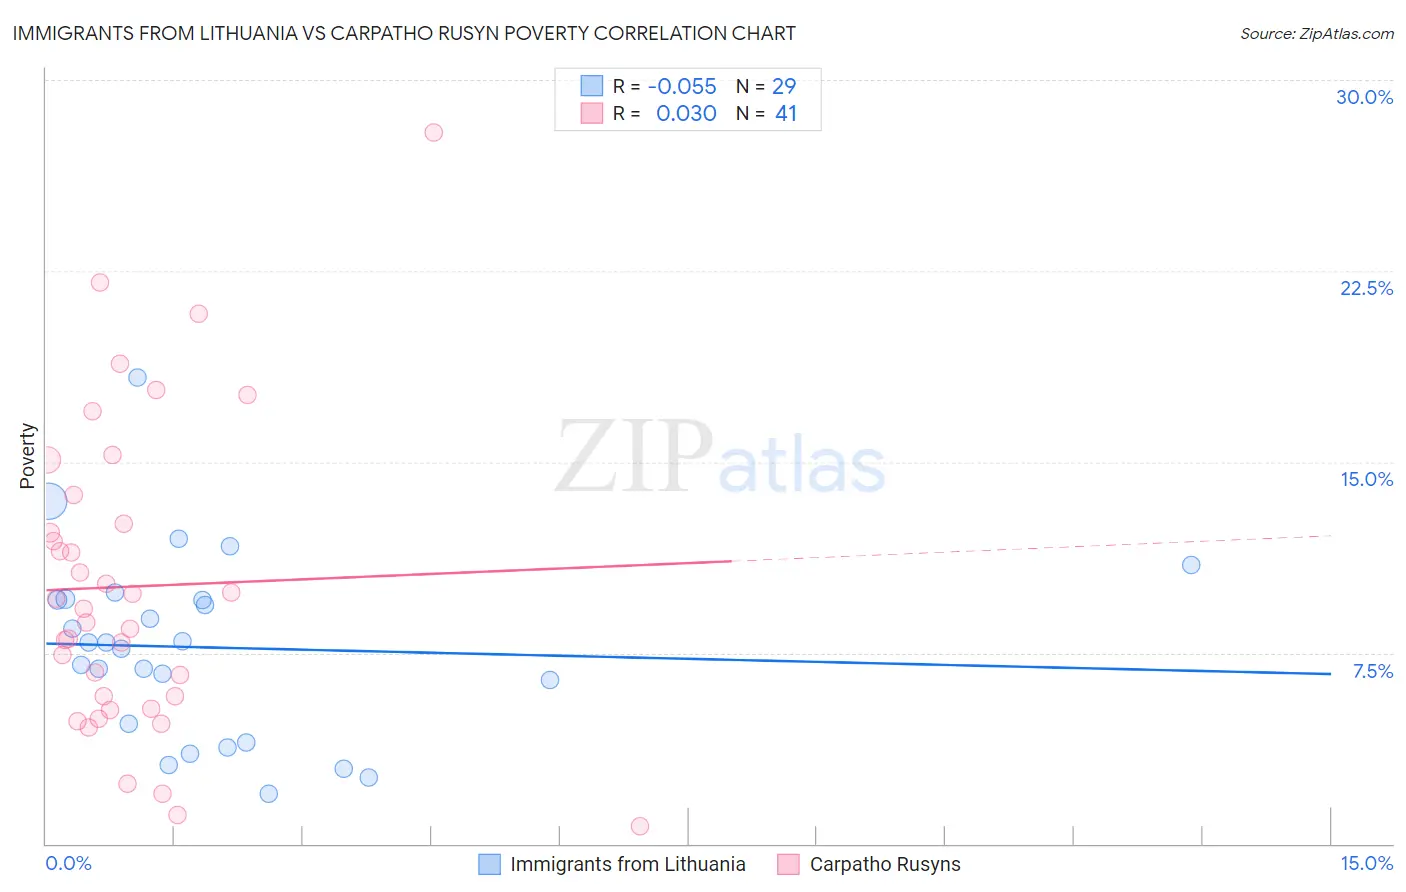
Immigrants from Lithuania vs Carpatho Rusyn Poverty Correlation Chart
The statistical analysis conducted on geographies consisting of 117,712,051 people shows a slight negative correlation between the proportion of Immigrants from Lithuania and poverty level in the United States with a correlation coefficient (R) of -0.055 and weighted average of 10.3%. Similarly, the statistical analysis conducted on geographies consisting of 58,869,628 people shows no correlation between the proportion of Carpatho Rusyns and poverty level in the United States with a correlation coefficient (R) of 0.030 and weighted average of 11.3%, a difference of 8.8%.
Poverty Correlation Summary
| Measurement | Immigrants from Lithuania | Carpatho Rusyn |
| Minimum | 2.0% | 0.68% |
| Maximum | 18.3% | 27.9% |
| Range | 16.4% | 27.2% |
| Mean | 7.7% | 10.1% |
| Median | 7.9% | 9.2% |
| Interquartile 25% (IQ1) | 4.3% | 5.6% |
| Interquartile 75% (IQ3) | 9.6% | 13.1% |
| Interquartile Range (IQR) | 5.3% | 7.6% |
| Standard Deviation (Sample) | 3.7% | 6.0% |
| Standard Deviation (Population) | 3.6% | 5.9% |
Similar Demographics by Poverty
Demographics Similar to Immigrants from Lithuania by Poverty
In terms of poverty, the demographic groups most similar to Immigrants from Lithuania are Bhutanese (10.4%, a difference of 0.35%), Immigrants from Hong Kong (10.4%, a difference of 0.57%), Immigrants from Bolivia (10.4%, a difference of 0.89%), Bolivian (10.4%, a difference of 0.89%), and Bulgarian (10.2%, a difference of 0.99%).
| Demographics | Rating | Rank | Poverty |
| Immigrants | Taiwan | 100.0 /100 | #4 | Exceptional 9.7% |
| Immigrants | Ireland | 99.9 /100 | #5 | Exceptional 10.1% |
| Assyrians/Chaldeans/Syriacs | 99.9 /100 | #6 | Exceptional 10.1% |
| Filipinos | 99.9 /100 | #7 | Exceptional 10.1% |
| Maltese | 99.9 /100 | #8 | Exceptional 10.2% |
| Immigrants | South Central Asia | 99.9 /100 | #9 | Exceptional 10.2% |
| Bulgarians | 99.9 /100 | #10 | Exceptional 10.2% |
| Immigrants | Lithuania | 99.9 /100 | #11 | Exceptional 10.3% |
| Bhutanese | 99.8 /100 | #12 | Exceptional 10.4% |
| Immigrants | Hong Kong | 99.8 /100 | #13 | Exceptional 10.4% |
| Immigrants | Bolivia | 99.8 /100 | #14 | Exceptional 10.4% |
| Bolivians | 99.8 /100 | #15 | Exceptional 10.4% |
| Lithuanians | 99.8 /100 | #16 | Exceptional 10.5% |
| Norwegians | 99.8 /100 | #17 | Exceptional 10.5% |
| Latvians | 99.8 /100 | #18 | Exceptional 10.5% |
Demographics Similar to Carpatho Rusyns by Poverty
In terms of poverty, the demographic groups most similar to Carpatho Rusyns are European (11.3%, a difference of 0.050%), Immigrants from Belgium (11.3%, a difference of 0.050%), Zimbabwean (11.3%, a difference of 0.070%), Immigrants from Canada (11.3%, a difference of 0.090%), and Serbian (11.2%, a difference of 0.18%).
| Demographics | Rating | Rank | Poverty |
| Immigrants | Australia | 97.4 /100 | #67 | Exceptional 11.2% |
| Slovaks | 97.4 /100 | #68 | Exceptional 11.2% |
| Serbians | 97.4 /100 | #69 | Exceptional 11.2% |
| Immigrants | Canada | 97.3 /100 | #70 | Exceptional 11.3% |
| Zimbabweans | 97.3 /100 | #71 | Exceptional 11.3% |
| Europeans | 97.2 /100 | #72 | Exceptional 11.3% |
| Immigrants | Belgium | 97.2 /100 | #73 | Exceptional 11.3% |
| Carpatho Rusyns | 97.2 /100 | #74 | Exceptional 11.3% |
| Immigrants | Eastern Europe | 97.0 /100 | #75 | Exceptional 11.3% |
| Immigrants | North America | 96.8 /100 | #76 | Exceptional 11.3% |
| Immigrants | Eastern Asia | 96.7 /100 | #77 | Exceptional 11.3% |
| Dutch | 96.7 /100 | #78 | Exceptional 11.3% |
| Cambodians | 96.7 /100 | #79 | Exceptional 11.3% |
| Indians (Asian) | 96.6 /100 | #80 | Exceptional 11.3% |
| Irish | 96.6 /100 | #81 | Exceptional 11.3% |