Immigrants from Liberia vs Shoshone Single Female Poverty
COMPARE
Immigrants from Liberia
Shoshone
Single Female Poverty
Single Female Poverty Comparison
Immigrants from Liberia
Shoshone
22.5%
SINGLE FEMALE POVERTY
0.9/ 100
METRIC RATING
253rd/ 347
METRIC RANK
25.1%
SINGLE FEMALE POVERTY
0.0/ 100
METRIC RATING
302nd/ 347
METRIC RANK
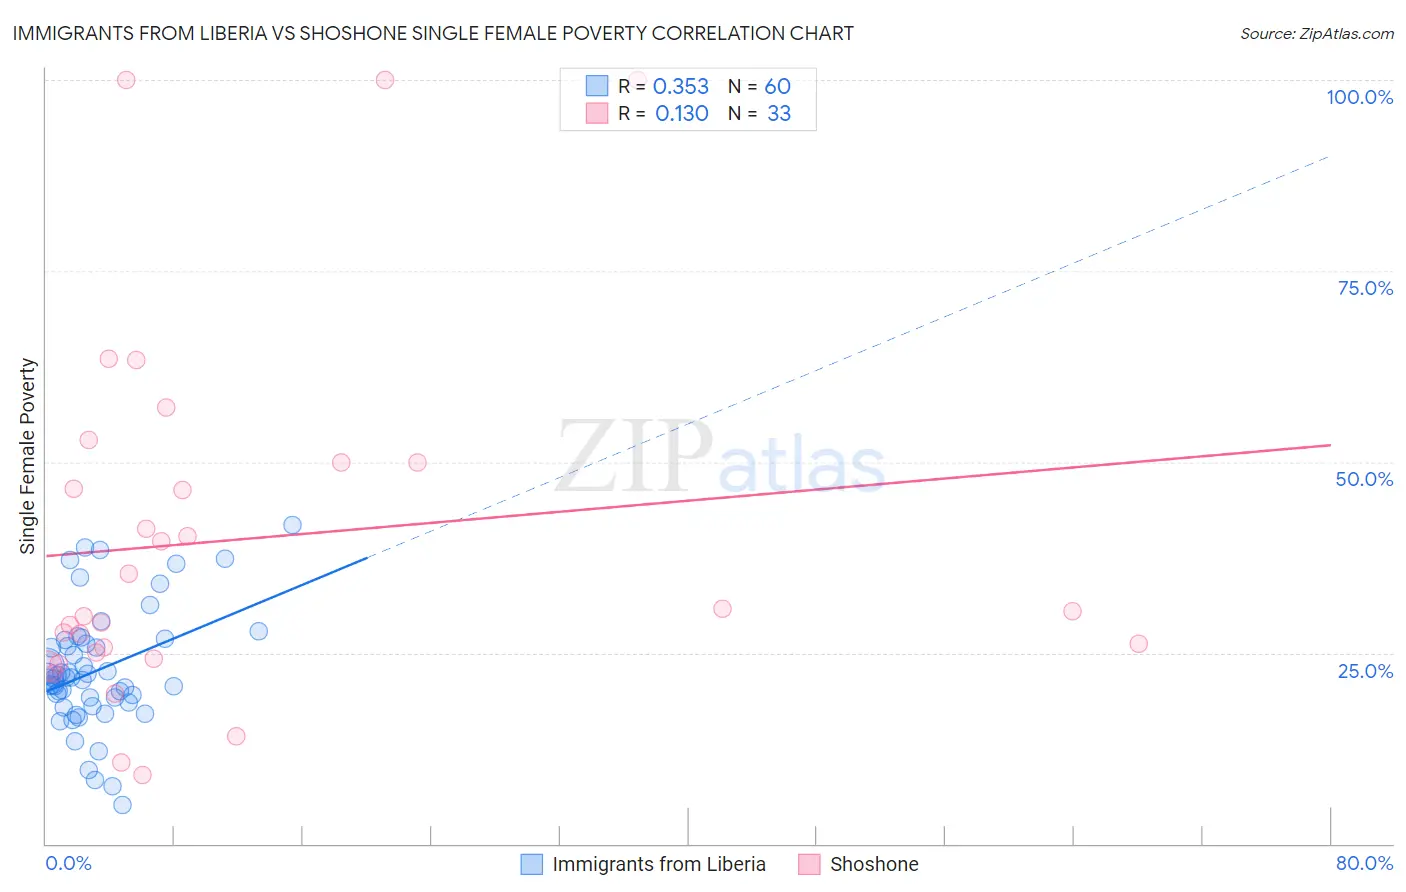
Immigrants from Liberia vs Shoshone Single Female Poverty Correlation Chart
The statistical analysis conducted on geographies consisting of 134,783,673 people shows a mild positive correlation between the proportion of Immigrants from Liberia and poverty level among single females in the United States with a correlation coefficient (R) of 0.353 and weighted average of 22.5%. Similarly, the statistical analysis conducted on geographies consisting of 66,449,019 people shows a poor positive correlation between the proportion of Shoshone and poverty level among single females in the United States with a correlation coefficient (R) of 0.130 and weighted average of 25.1%, a difference of 11.5%.
Single Female Poverty Correlation Summary
| Measurement | Immigrants from Liberia | Shoshone |
| Minimum | 5.1% | 9.1% |
| Maximum | 41.8% | 100.0% |
| Range | 36.7% | 90.9% |
| Mean | 22.7% | 39.8% |
| Median | 21.7% | 30.4% |
| Interquartile 25% (IQ1) | 18.9% | 24.6% |
| Interquartile 75% (IQ3) | 26.4% | 50.0% |
| Interquartile Range (IQR) | 7.5% | 25.4% |
| Standard Deviation (Sample) | 7.7% | 23.8% |
| Standard Deviation (Population) | 7.7% | 23.4% |
Similar Demographics by Single Female Poverty
Demographics Similar to Immigrants from Liberia by Single Female Poverty
In terms of single female poverty, the demographic groups most similar to Immigrants from Liberia are Delaware (22.5%, a difference of 0.090%), Immigrants from Burma/Myanmar (22.6%, a difference of 0.10%), Immigrants from Sudan (22.6%, a difference of 0.10%), Immigrants from West Indies (22.5%, a difference of 0.20%), and Immigrants from Belize (22.6%, a difference of 0.25%).
| Demographics | Rating | Rank | Single Female Poverty |
| Liberians | 1.4 /100 | #246 | Tragic 22.4% |
| Immigrants | El Salvador | 1.4 /100 | #247 | Tragic 22.4% |
| Belizeans | 1.4 /100 | #248 | Tragic 22.4% |
| Immigrants | Caribbean | 1.3 /100 | #249 | Tragic 22.4% |
| Immigrants | Bahamas | 1.2 /100 | #250 | Tragic 22.5% |
| Immigrants | West Indies | 1.0 /100 | #251 | Tragic 22.5% |
| Delaware | 1.0 /100 | #252 | Tragic 22.5% |
| Immigrants | Liberia | 0.9 /100 | #253 | Tragic 22.5% |
| Immigrants | Burma/Myanmar | 0.8 /100 | #254 | Tragic 22.6% |
| Immigrants | Sudan | 0.8 /100 | #255 | Tragic 22.6% |
| Immigrants | Belize | 0.8 /100 | #256 | Tragic 22.6% |
| Sudanese | 0.7 /100 | #257 | Tragic 22.6% |
| Bahamians | 0.6 /100 | #258 | Tragic 22.7% |
| Whites/Caucasians | 0.6 /100 | #259 | Tragic 22.7% |
| Celtics | 0.5 /100 | #260 | Tragic 22.7% |
Demographics Similar to Shoshone by Single Female Poverty
In terms of single female poverty, the demographic groups most similar to Shoshone are Honduran (25.1%, a difference of 0.090%), Blackfeet (25.1%, a difference of 0.26%), Mexican (25.0%, a difference of 0.34%), Somali (25.2%, a difference of 0.40%), and Immigrants from Congo (25.3%, a difference of 0.66%).
| Demographics | Rating | Rank | Single Female Poverty |
| Hispanics or Latinos | 0.0 /100 | #295 | Tragic 24.6% |
| Africans | 0.0 /100 | #296 | Tragic 24.8% |
| Immigrants | Central America | 0.0 /100 | #297 | Tragic 24.8% |
| Yaqui | 0.0 /100 | #298 | Tragic 24.9% |
| Mexicans | 0.0 /100 | #299 | Tragic 25.0% |
| Blackfeet | 0.0 /100 | #300 | Tragic 25.1% |
| Hondurans | 0.0 /100 | #301 | Tragic 25.1% |
| Shoshone | 0.0 /100 | #302 | Tragic 25.1% |
| Somalis | 0.0 /100 | #303 | Tragic 25.2% |
| Immigrants | Congo | 0.0 /100 | #304 | Tragic 25.3% |
| Immigrants | Dominican Republic | 0.0 /100 | #305 | Tragic 25.3% |
| Immigrants | Mexico | 0.0 /100 | #306 | Tragic 25.3% |
| Potawatomi | 0.0 /100 | #307 | Tragic 25.4% |
| Aleuts | 0.0 /100 | #308 | Tragic 25.4% |
| Dominicans | 0.0 /100 | #309 | Tragic 25.4% |