Immigrants from Liberia vs Menominee Single Female Poverty
COMPARE
Immigrants from Liberia
Menominee
Single Female Poverty
Single Female Poverty Comparison
Immigrants from Liberia
Menominee
22.5%
SINGLE FEMALE POVERTY
0.9/ 100
METRIC RATING
253rd/ 347
METRIC RANK
27.8%
SINGLE FEMALE POVERTY
0.0/ 100
METRIC RATING
329th/ 347
METRIC RANK
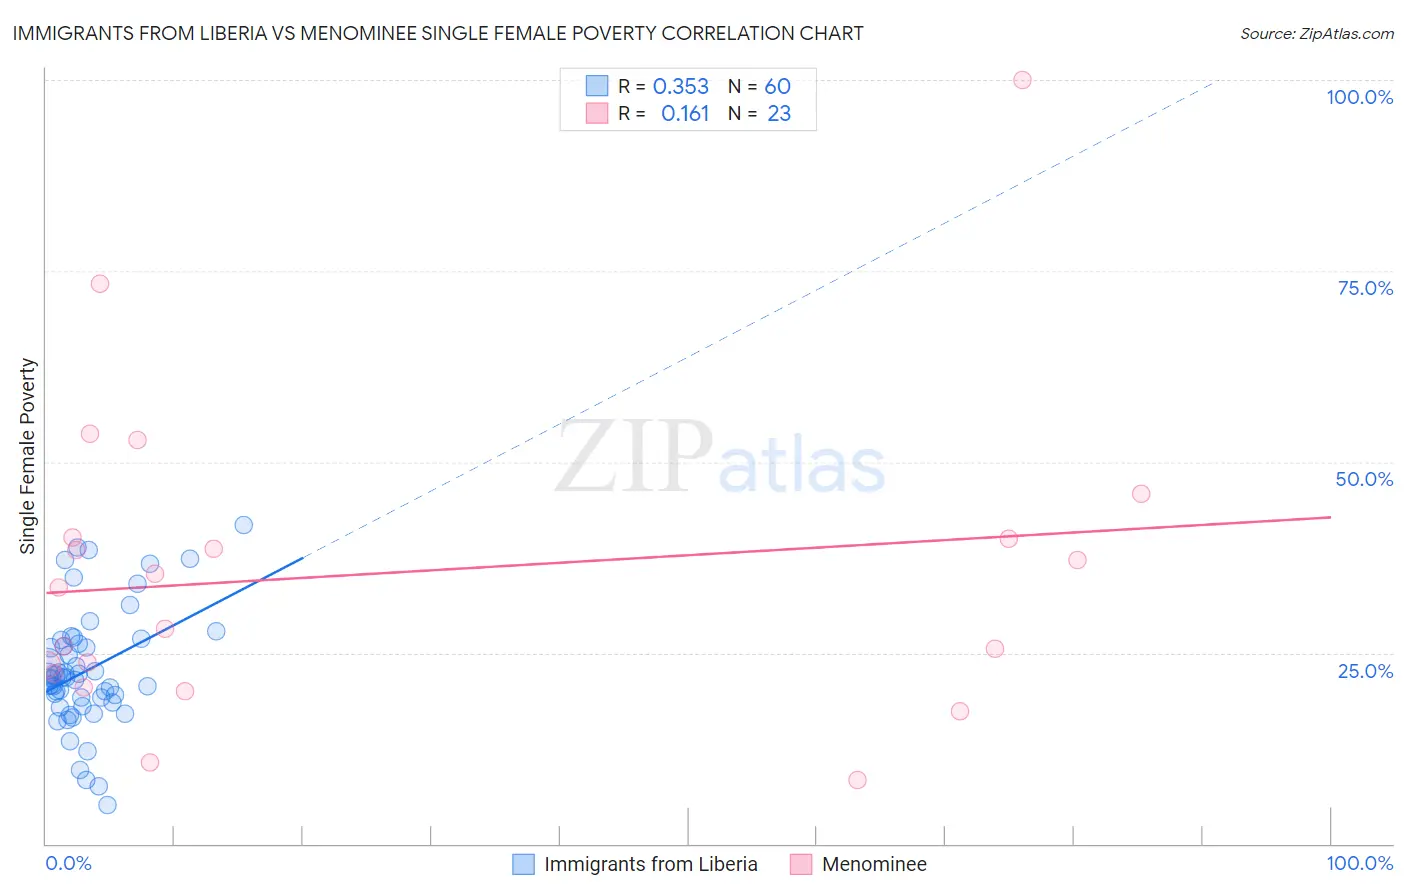
Immigrants from Liberia vs Menominee Single Female Poverty Correlation Chart
The statistical analysis conducted on geographies consisting of 134,783,673 people shows a mild positive correlation between the proportion of Immigrants from Liberia and poverty level among single females in the United States with a correlation coefficient (R) of 0.353 and weighted average of 22.5%. Similarly, the statistical analysis conducted on geographies consisting of 45,620,212 people shows a poor positive correlation between the proportion of Menominee and poverty level among single females in the United States with a correlation coefficient (R) of 0.161 and weighted average of 27.8%, a difference of 23.5%.
Single Female Poverty Correlation Summary
| Measurement | Immigrants from Liberia | Menominee |
| Minimum | 5.1% | 8.3% |
| Maximum | 41.8% | 100.0% |
| Range | 36.7% | 91.7% |
| Mean | 22.7% | 35.4% |
| Median | 21.7% | 33.5% |
| Interquartile 25% (IQ1) | 18.9% | 22.3% |
| Interquartile 75% (IQ3) | 26.4% | 40.1% |
| Interquartile Range (IQR) | 7.5% | 17.8% |
| Standard Deviation (Sample) | 7.7% | 20.5% |
| Standard Deviation (Population) | 7.7% | 20.1% |
Similar Demographics by Single Female Poverty
Demographics Similar to Immigrants from Liberia by Single Female Poverty
In terms of single female poverty, the demographic groups most similar to Immigrants from Liberia are Delaware (22.5%, a difference of 0.090%), Immigrants from Burma/Myanmar (22.6%, a difference of 0.10%), Immigrants from Sudan (22.6%, a difference of 0.10%), Immigrants from West Indies (22.5%, a difference of 0.20%), and Immigrants from Belize (22.6%, a difference of 0.25%).
| Demographics | Rating | Rank | Single Female Poverty |
| Liberians | 1.4 /100 | #246 | Tragic 22.4% |
| Immigrants | El Salvador | 1.4 /100 | #247 | Tragic 22.4% |
| Belizeans | 1.4 /100 | #248 | Tragic 22.4% |
| Immigrants | Caribbean | 1.3 /100 | #249 | Tragic 22.4% |
| Immigrants | Bahamas | 1.2 /100 | #250 | Tragic 22.5% |
| Immigrants | West Indies | 1.0 /100 | #251 | Tragic 22.5% |
| Delaware | 1.0 /100 | #252 | Tragic 22.5% |
| Immigrants | Liberia | 0.9 /100 | #253 | Tragic 22.5% |
| Immigrants | Burma/Myanmar | 0.8 /100 | #254 | Tragic 22.6% |
| Immigrants | Sudan | 0.8 /100 | #255 | Tragic 22.6% |
| Immigrants | Belize | 0.8 /100 | #256 | Tragic 22.6% |
| Sudanese | 0.7 /100 | #257 | Tragic 22.6% |
| Bahamians | 0.6 /100 | #258 | Tragic 22.7% |
| Whites/Caucasians | 0.6 /100 | #259 | Tragic 22.7% |
| Celtics | 0.5 /100 | #260 | Tragic 22.7% |
Demographics Similar to Menominee by Single Female Poverty
In terms of single female poverty, the demographic groups most similar to Menominee are Apache (27.7%, a difference of 0.46%), Hopi (28.0%, a difference of 0.71%), Native/Alaskan (28.2%, a difference of 1.3%), Dutch West Indian (27.5%, a difference of 1.4%), and Creek (27.4%, a difference of 1.5%).
| Demographics | Rating | Rank | Single Female Poverty |
| Seminole | 0.0 /100 | #322 | Tragic 26.8% |
| Chippewa | 0.0 /100 | #323 | Tragic 26.8% |
| Kiowa | 0.0 /100 | #324 | Tragic 26.9% |
| Choctaw | 0.0 /100 | #325 | Tragic 27.2% |
| Creek | 0.0 /100 | #326 | Tragic 27.4% |
| Dutch West Indians | 0.0 /100 | #327 | Tragic 27.5% |
| Apache | 0.0 /100 | #328 | Tragic 27.7% |
| Menominee | 0.0 /100 | #329 | Tragic 27.8% |
| Hopi | 0.0 /100 | #330 | Tragic 28.0% |
| Natives/Alaskans | 0.0 /100 | #331 | Tragic 28.2% |
| Yakama | 0.0 /100 | #332 | Tragic 28.3% |
| Ute | 0.0 /100 | #333 | Tragic 28.4% |
| Pueblo | 0.0 /100 | #334 | Tragic 28.6% |
| Immigrants | Yemen | 0.0 /100 | #335 | Tragic 28.9% |
| Colville | 0.0 /100 | #336 | Tragic 29.1% |