Immigrants from Liberia vs Shoshone Hearing Disability
COMPARE
Immigrants from Liberia
Shoshone
Hearing Disability
Hearing Disability Comparison
Immigrants from Liberia
Shoshone
2.8%
HEARING DISABILITY
90.0/ 100
METRIC RATING
117th/ 347
METRIC RANK
4.0%
HEARING DISABILITY
0.0/ 100
METRIC RATING
320th/ 347
METRIC RANK
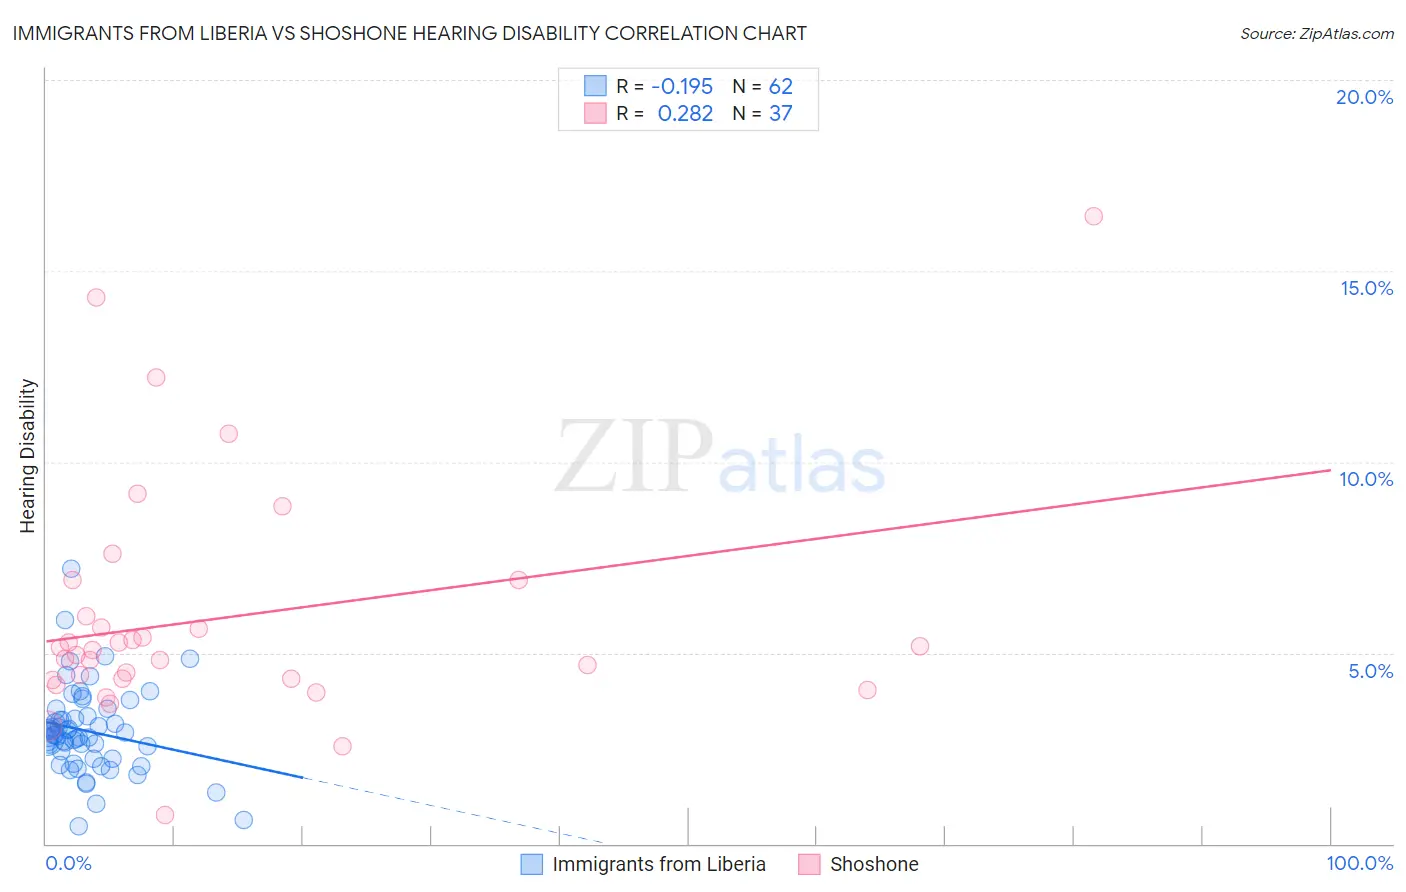
Immigrants from Liberia vs Shoshone Hearing Disability Correlation Chart
The statistical analysis conducted on geographies consisting of 135,218,805 people shows a poor negative correlation between the proportion of Immigrants from Liberia and percentage of population with hearing disability in the United States with a correlation coefficient (R) of -0.195 and weighted average of 2.8%. Similarly, the statistical analysis conducted on geographies consisting of 66,619,523 people shows a weak positive correlation between the proportion of Shoshone and percentage of population with hearing disability in the United States with a correlation coefficient (R) of 0.282 and weighted average of 4.0%, a difference of 41.7%.
Hearing Disability Correlation Summary
| Measurement | Immigrants from Liberia | Shoshone |
| Minimum | 0.44% | 0.77% |
| Maximum | 7.2% | 16.4% |
| Range | 6.7% | 15.7% |
| Mean | 3.0% | 5.9% |
| Median | 2.8% | 5.1% |
| Interquartile 25% (IQ1) | 2.2% | 4.3% |
| Interquartile 75% (IQ3) | 3.3% | 6.4% |
| Interquartile Range (IQR) | 1.1% | 2.1% |
| Standard Deviation (Sample) | 1.1% | 3.1% |
| Standard Deviation (Population) | 1.1% | 3.1% |
Similar Demographics by Hearing Disability
Demographics Similar to Immigrants from Liberia by Hearing Disability
In terms of hearing disability, the demographic groups most similar to Immigrants from Liberia are Zimbabwean (2.8%, a difference of 0.010%), Kenyan (2.8%, a difference of 0.030%), Immigrants (2.8%, a difference of 0.090%), Jordanian (2.8%, a difference of 0.13%), and Immigrants from Latin America (2.8%, a difference of 0.15%).
| Demographics | Rating | Rank | Hearing Disability |
| Cypriots | 92.9 /100 | #110 | Exceptional 2.8% |
| Immigrants | Yemen | 92.7 /100 | #111 | Exceptional 2.8% |
| U.S. Virgin Islanders | 92.5 /100 | #112 | Exceptional 2.8% |
| Immigrants | Belarus | 91.6 /100 | #113 | Exceptional 2.8% |
| Cambodians | 91.1 /100 | #114 | Exceptional 2.8% |
| Immigrants | Latin America | 90.5 /100 | #115 | Exceptional 2.8% |
| Immigrants | Immigrants | 90.3 /100 | #116 | Exceptional 2.8% |
| Immigrants | Liberia | 90.0 /100 | #117 | Excellent 2.8% |
| Zimbabweans | 89.9 /100 | #118 | Excellent 2.8% |
| Kenyans | 89.8 /100 | #119 | Excellent 2.8% |
| Jordanians | 89.5 /100 | #120 | Excellent 2.8% |
| Cubans | 89.4 /100 | #121 | Excellent 2.8% |
| Liberians | 89.0 /100 | #122 | Excellent 2.8% |
| Immigrants | Zaire | 88.6 /100 | #123 | Excellent 2.9% |
| Bahamians | 88.6 /100 | #124 | Excellent 2.9% |
Demographics Similar to Shoshone by Hearing Disability
In terms of hearing disability, the demographic groups most similar to Shoshone are Chippewa (4.0%, a difference of 0.81%), Paiute (4.1%, a difference of 1.2%), Cheyenne (4.0%, a difference of 1.5%), Seminole (4.1%, a difference of 1.5%), and Comanche (4.0%, a difference of 1.6%).
| Demographics | Rating | Rank | Hearing Disability |
| Hopi | 0.0 /100 | #313 | Tragic 3.9% |
| Yakama | 0.0 /100 | #314 | Tragic 3.9% |
| Puget Sound Salish | 0.0 /100 | #315 | Tragic 3.9% |
| Spanish Americans | 0.0 /100 | #316 | Tragic 4.0% |
| Comanche | 0.0 /100 | #317 | Tragic 4.0% |
| Cheyenne | 0.0 /100 | #318 | Tragic 4.0% |
| Chippewa | 0.0 /100 | #319 | Tragic 4.0% |
| Shoshone | 0.0 /100 | #320 | Tragic 4.0% |
| Paiute | 0.0 /100 | #321 | Tragic 4.1% |
| Seminole | 0.0 /100 | #322 | Tragic 4.1% |
| Apache | 0.0 /100 | #323 | Tragic 4.1% |
| Osage | 0.0 /100 | #324 | Tragic 4.1% |
| Lumbee | 0.0 /100 | #325 | Tragic 4.1% |
| Potawatomi | 0.0 /100 | #326 | Tragic 4.1% |
| Arapaho | 0.0 /100 | #327 | Tragic 4.1% |