Immigrants from Africa vs Shoshone Single Female Poverty
COMPARE
Immigrants from Africa
Shoshone
Single Female Poverty
Single Female Poverty Comparison
Immigrants from Africa
Shoshone
21.5%
SINGLE FEMALE POVERTY
16.7/ 100
METRIC RATING
204th/ 347
METRIC RANK
25.1%
SINGLE FEMALE POVERTY
0.0/ 100
METRIC RATING
302nd/ 347
METRIC RANK
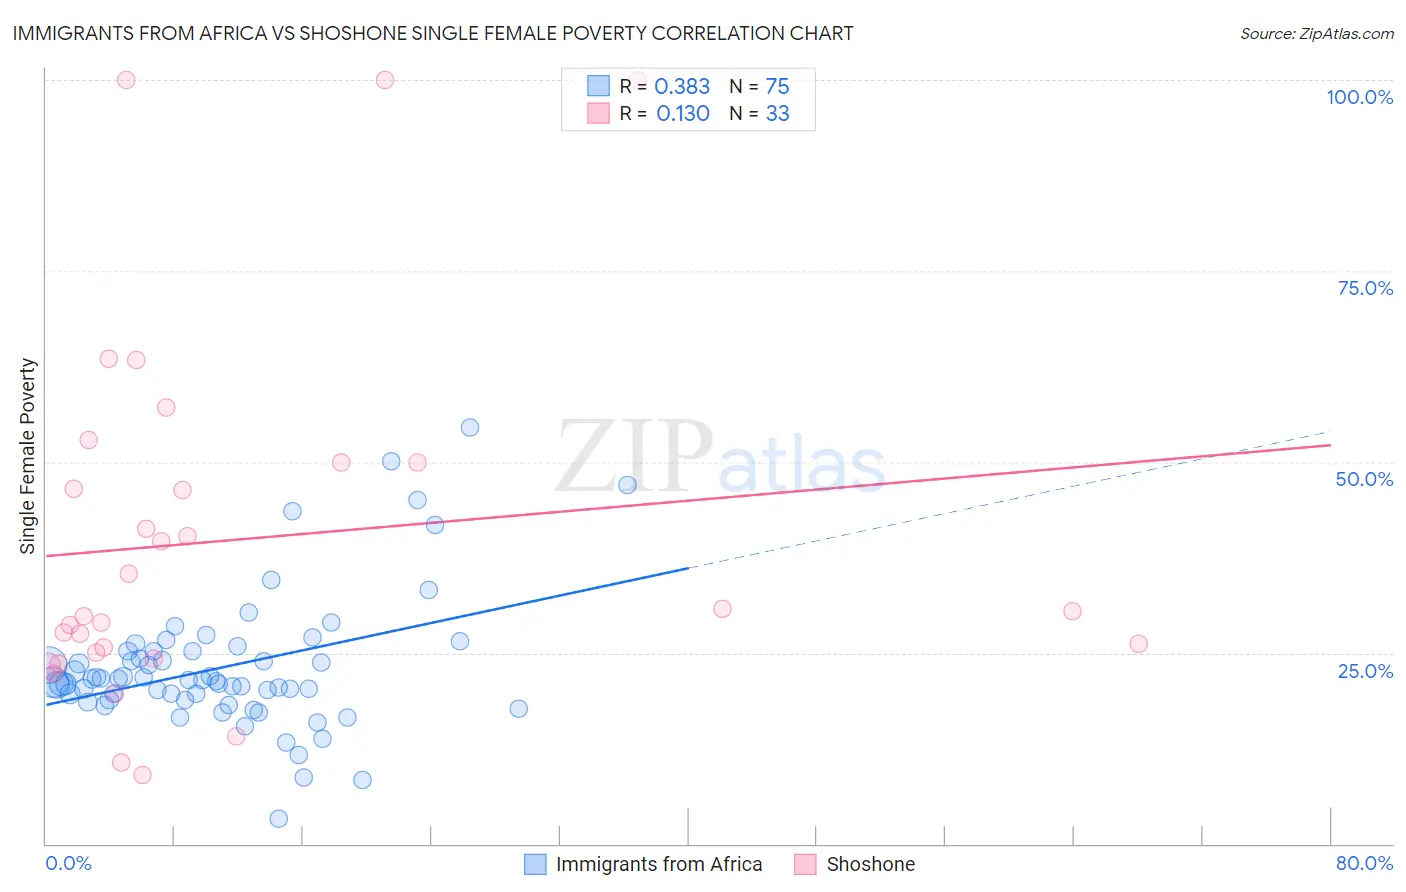
Immigrants from Africa vs Shoshone Single Female Poverty Correlation Chart
The statistical analysis conducted on geographies consisting of 460,681,104 people shows a mild positive correlation between the proportion of Immigrants from Africa and poverty level among single females in the United States with a correlation coefficient (R) of 0.383 and weighted average of 21.5%. Similarly, the statistical analysis conducted on geographies consisting of 66,449,019 people shows a poor positive correlation between the proportion of Shoshone and poverty level among single females in the United States with a correlation coefficient (R) of 0.130 and weighted average of 25.1%, a difference of 16.7%.
Single Female Poverty Correlation Summary
| Measurement | Immigrants from Africa | Shoshone |
| Minimum | 3.3% | 9.1% |
| Maximum | 54.5% | 100.0% |
| Range | 51.2% | 90.9% |
| Mean | 23.1% | 39.8% |
| Median | 21.5% | 30.4% |
| Interquartile 25% (IQ1) | 18.9% | 24.6% |
| Interquartile 75% (IQ3) | 25.2% | 50.0% |
| Interquartile Range (IQR) | 6.3% | 25.4% |
| Standard Deviation (Sample) | 8.8% | 23.8% |
| Standard Deviation (Population) | 8.7% | 23.4% |
Similar Demographics by Single Female Poverty
Demographics Similar to Immigrants from Africa by Single Female Poverty
In terms of single female poverty, the demographic groups most similar to Immigrants from Africa are Finnish (21.5%, a difference of 0.060%), Belgian (21.5%, a difference of 0.070%), Ghanaian (21.6%, a difference of 0.11%), Haitian (21.6%, a difference of 0.15%), and Immigrants from Eastern Africa (21.6%, a difference of 0.18%).
| Demographics | Rating | Rank | Single Female Poverty |
| Japanese | 26.4 /100 | #197 | Fair 21.3% |
| Swiss | 24.2 /100 | #198 | Fair 21.4% |
| Immigrants | Immigrants | 22.0 /100 | #199 | Fair 21.4% |
| Irish | 21.4 /100 | #200 | Fair 21.4% |
| Nigerians | 20.9 /100 | #201 | Fair 21.4% |
| Immigrants | Kenya | 20.7 /100 | #202 | Fair 21.4% |
| Immigrants | Haiti | 18.8 /100 | #203 | Poor 21.5% |
| Immigrants | Africa | 16.7 /100 | #204 | Poor 21.5% |
| Finns | 16.2 /100 | #205 | Poor 21.5% |
| Belgians | 16.1 /100 | #206 | Poor 21.5% |
| Ghanaians | 15.7 /100 | #207 | Poor 21.6% |
| Haitians | 15.4 /100 | #208 | Poor 21.6% |
| Immigrants | Eastern Africa | 15.1 /100 | #209 | Poor 21.6% |
| Immigrants | Panama | 14.4 /100 | #210 | Poor 21.6% |
| Icelanders | 14.0 /100 | #211 | Poor 21.6% |
Demographics Similar to Shoshone by Single Female Poverty
In terms of single female poverty, the demographic groups most similar to Shoshone are Honduran (25.1%, a difference of 0.090%), Blackfeet (25.1%, a difference of 0.26%), Mexican (25.0%, a difference of 0.34%), Somali (25.2%, a difference of 0.40%), and Immigrants from Congo (25.3%, a difference of 0.66%).
| Demographics | Rating | Rank | Single Female Poverty |
| Hispanics or Latinos | 0.0 /100 | #295 | Tragic 24.6% |
| Africans | 0.0 /100 | #296 | Tragic 24.8% |
| Immigrants | Central America | 0.0 /100 | #297 | Tragic 24.8% |
| Yaqui | 0.0 /100 | #298 | Tragic 24.9% |
| Mexicans | 0.0 /100 | #299 | Tragic 25.0% |
| Blackfeet | 0.0 /100 | #300 | Tragic 25.1% |
| Hondurans | 0.0 /100 | #301 | Tragic 25.1% |
| Shoshone | 0.0 /100 | #302 | Tragic 25.1% |
| Somalis | 0.0 /100 | #303 | Tragic 25.2% |
| Immigrants | Congo | 0.0 /100 | #304 | Tragic 25.3% |
| Immigrants | Dominican Republic | 0.0 /100 | #305 | Tragic 25.3% |
| Immigrants | Mexico | 0.0 /100 | #306 | Tragic 25.3% |
| Potawatomi | 0.0 /100 | #307 | Tragic 25.4% |
| Aleuts | 0.0 /100 | #308 | Tragic 25.4% |
| Dominicans | 0.0 /100 | #309 | Tragic 25.4% |