Immigrants from Liberia vs Pima Single Female Poverty
COMPARE
Immigrants from Liberia
Pima
Single Female Poverty
Single Female Poverty Comparison
Immigrants from Liberia
Pima
22.5%
SINGLE FEMALE POVERTY
0.9/ 100
METRIC RATING
253rd/ 347
METRIC RANK
30.3%
SINGLE FEMALE POVERTY
0.0/ 100
METRIC RATING
338th/ 347
METRIC RANK
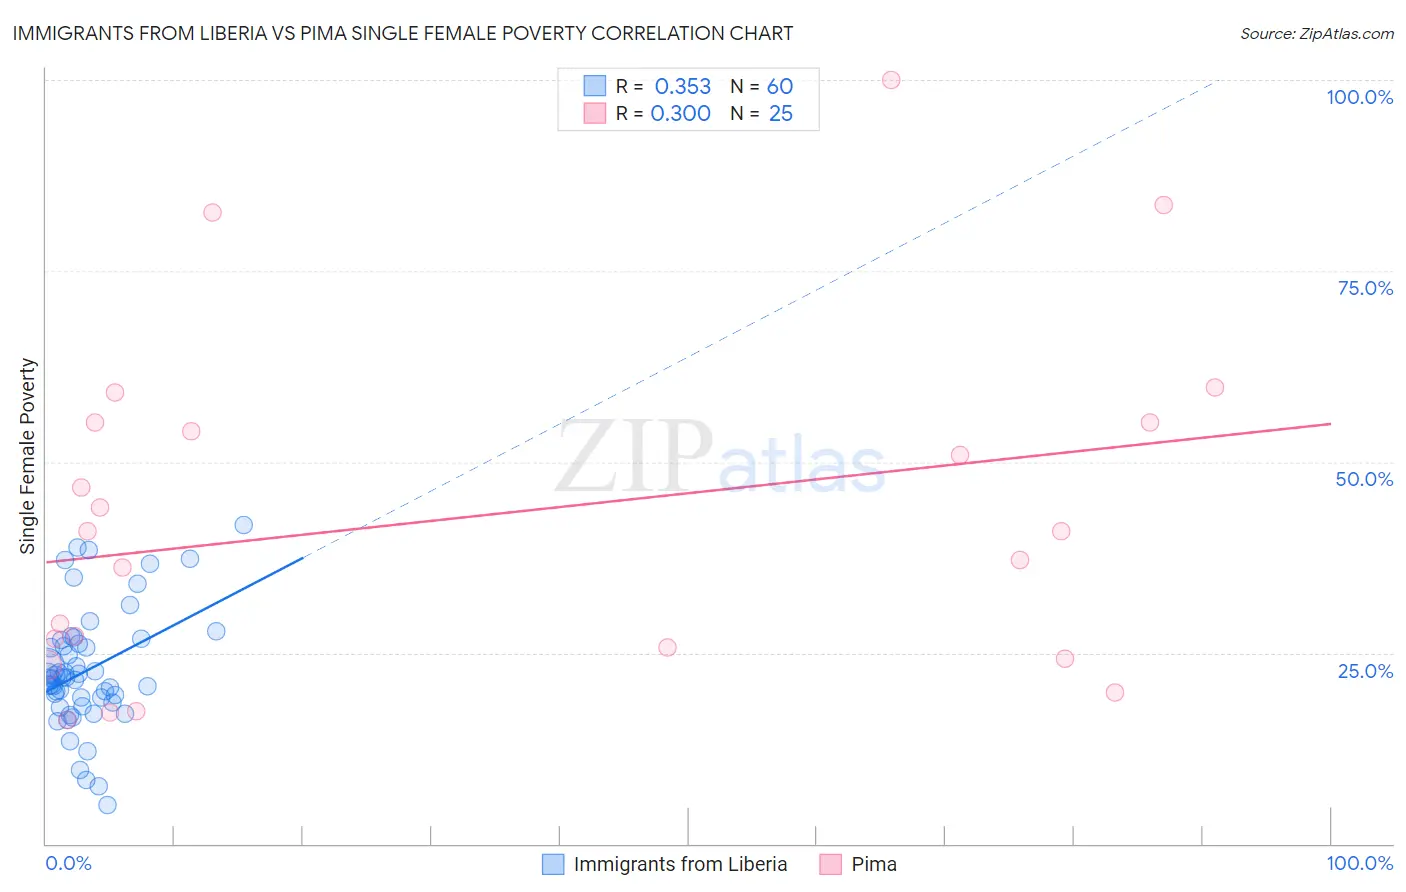
Immigrants from Liberia vs Pima Single Female Poverty Correlation Chart
The statistical analysis conducted on geographies consisting of 134,783,673 people shows a mild positive correlation between the proportion of Immigrants from Liberia and poverty level among single females in the United States with a correlation coefficient (R) of 0.353 and weighted average of 22.5%. Similarly, the statistical analysis conducted on geographies consisting of 61,414,275 people shows a mild positive correlation between the proportion of Pima and poverty level among single females in the United States with a correlation coefficient (R) of 0.300 and weighted average of 30.3%, a difference of 34.6%.
Single Female Poverty Correlation Summary
| Measurement | Immigrants from Liberia | Pima |
| Minimum | 5.1% | 16.1% |
| Maximum | 41.8% | 100.0% |
| Range | 36.7% | 83.9% |
| Mean | 22.7% | 42.9% |
| Median | 21.7% | 41.0% |
| Interquartile 25% (IQ1) | 18.9% | 24.9% |
| Interquartile 75% (IQ3) | 26.4% | 55.1% |
| Interquartile Range (IQR) | 7.5% | 30.2% |
| Standard Deviation (Sample) | 7.7% | 22.3% |
| Standard Deviation (Population) | 7.7% | 21.8% |
Similar Demographics by Single Female Poverty
Demographics Similar to Immigrants from Liberia by Single Female Poverty
In terms of single female poverty, the demographic groups most similar to Immigrants from Liberia are Delaware (22.5%, a difference of 0.090%), Immigrants from Burma/Myanmar (22.6%, a difference of 0.10%), Immigrants from Sudan (22.6%, a difference of 0.10%), Immigrants from West Indies (22.5%, a difference of 0.20%), and Immigrants from Belize (22.6%, a difference of 0.25%).
| Demographics | Rating | Rank | Single Female Poverty |
| Liberians | 1.4 /100 | #246 | Tragic 22.4% |
| Immigrants | El Salvador | 1.4 /100 | #247 | Tragic 22.4% |
| Belizeans | 1.4 /100 | #248 | Tragic 22.4% |
| Immigrants | Caribbean | 1.3 /100 | #249 | Tragic 22.4% |
| Immigrants | Bahamas | 1.2 /100 | #250 | Tragic 22.5% |
| Immigrants | West Indies | 1.0 /100 | #251 | Tragic 22.5% |
| Delaware | 1.0 /100 | #252 | Tragic 22.5% |
| Immigrants | Liberia | 0.9 /100 | #253 | Tragic 22.5% |
| Immigrants | Burma/Myanmar | 0.8 /100 | #254 | Tragic 22.6% |
| Immigrants | Sudan | 0.8 /100 | #255 | Tragic 22.6% |
| Immigrants | Belize | 0.8 /100 | #256 | Tragic 22.6% |
| Sudanese | 0.7 /100 | #257 | Tragic 22.6% |
| Bahamians | 0.6 /100 | #258 | Tragic 22.7% |
| Whites/Caucasians | 0.6 /100 | #259 | Tragic 22.7% |
| Celtics | 0.5 /100 | #260 | Tragic 22.7% |
Demographics Similar to Pima by Single Female Poverty
In terms of single female poverty, the demographic groups most similar to Pima are Cheyenne (30.4%, a difference of 0.22%), Cajun (30.6%, a difference of 1.0%), Yuman (29.4%, a difference of 3.0%), Sioux (31.3%, a difference of 3.0%), and Colville (29.1%, a difference of 4.3%).
| Demographics | Rating | Rank | Single Female Poverty |
| Natives/Alaskans | 0.0 /100 | #331 | Tragic 28.2% |
| Yakama | 0.0 /100 | #332 | Tragic 28.3% |
| Ute | 0.0 /100 | #333 | Tragic 28.4% |
| Pueblo | 0.0 /100 | #334 | Tragic 28.6% |
| Immigrants | Yemen | 0.0 /100 | #335 | Tragic 28.9% |
| Colville | 0.0 /100 | #336 | Tragic 29.1% |
| Yuman | 0.0 /100 | #337 | Tragic 29.4% |
| Pima | 0.0 /100 | #338 | Tragic 30.3% |
| Cheyenne | 0.0 /100 | #339 | Tragic 30.4% |
| Cajuns | 0.0 /100 | #340 | Tragic 30.6% |
| Sioux | 0.0 /100 | #341 | Tragic 31.3% |
| Navajo | 0.0 /100 | #342 | Tragic 31.7% |
| Crow | 0.0 /100 | #343 | Tragic 32.4% |
| Lumbee | 0.0 /100 | #344 | Tragic 33.0% |
| Houma | 0.0 /100 | #345 | Tragic 33.8% |