Immigrants from Lebanon vs Osage Married-Couple Family Poverty
COMPARE
Immigrants from Lebanon
Osage
Married-Couple Family Poverty
Married-Couple Family Poverty Comparison
Immigrants from Lebanon
Osage
6.6%
MARRIED-COUPLE FAMILY POVERTY
0.0/ 100
METRIC RATING
292nd/ 347
METRIC RANK
5.4%
MARRIED-COUPLE FAMILY POVERTY
18.4/ 100
METRIC RATING
206th/ 347
METRIC RANK
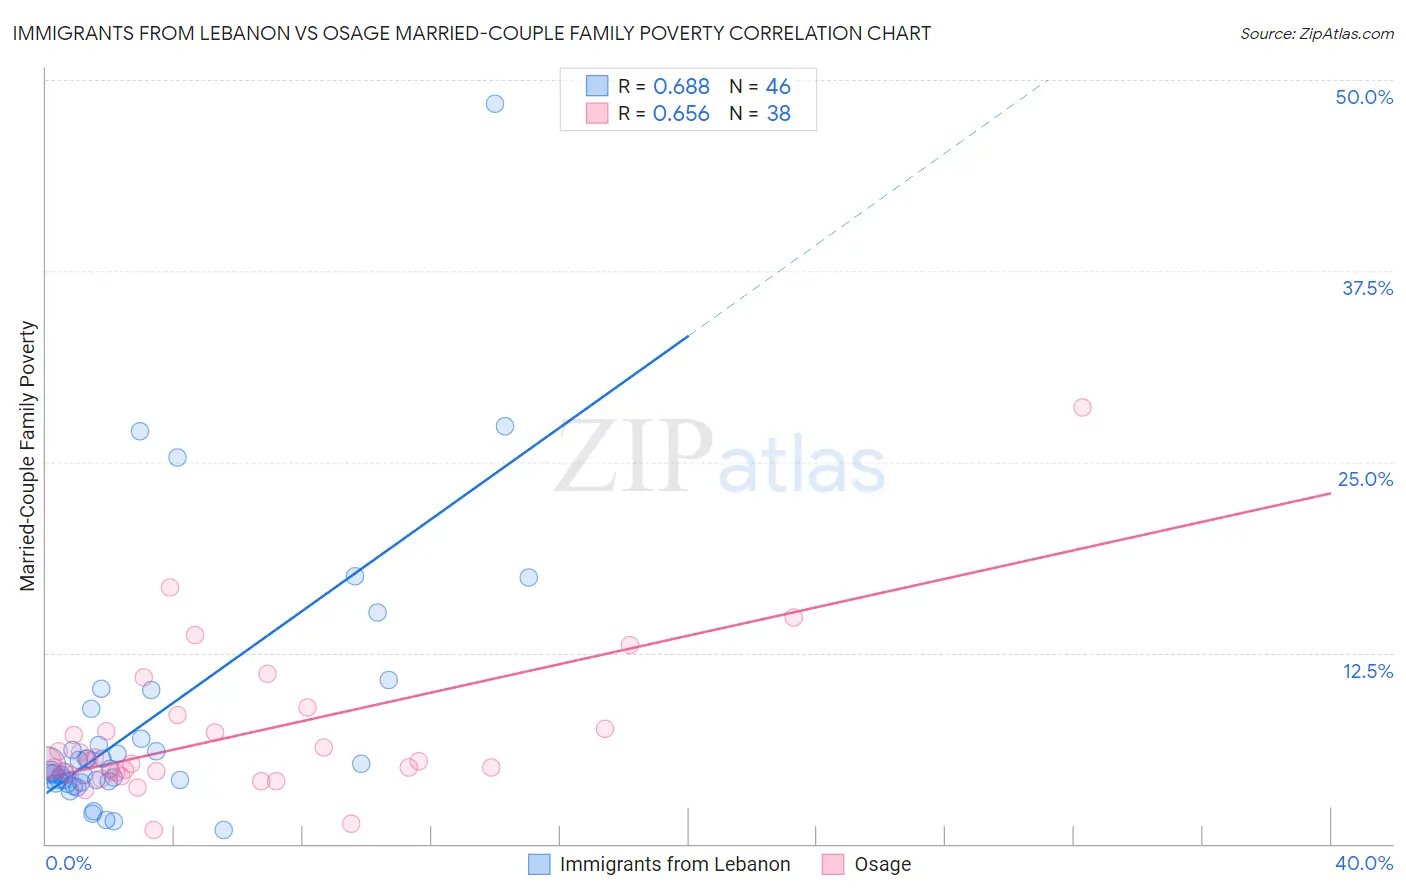
Immigrants from Lebanon vs Osage Married-Couple Family Poverty Correlation Chart
The statistical analysis conducted on geographies consisting of 216,189,753 people shows a significant positive correlation between the proportion of Immigrants from Lebanon and poverty level among married-couple families in the United States with a correlation coefficient (R) of 0.688 and weighted average of 6.6%. Similarly, the statistical analysis conducted on geographies consisting of 91,686,169 people shows a significant positive correlation between the proportion of Osage and poverty level among married-couple families in the United States with a correlation coefficient (R) of 0.656 and weighted average of 5.4%, a difference of 20.5%.
Married-Couple Family Poverty Correlation Summary
| Measurement | Immigrants from Lebanon | Osage |
| Minimum | 0.93% | 0.88% |
| Maximum | 48.5% | 28.6% |
| Range | 47.6% | 27.7% |
| Mean | 8.0% | 7.1% |
| Median | 4.8% | 5.3% |
| Interquartile 25% (IQ1) | 4.1% | 4.7% |
| Interquartile 75% (IQ3) | 6.8% | 7.6% |
| Interquartile Range (IQR) | 2.8% | 2.9% |
| Standard Deviation (Sample) | 8.8% | 5.0% |
| Standard Deviation (Population) | 8.7% | 4.9% |
Similar Demographics by Married-Couple Family Poverty
Demographics Similar to Immigrants from Lebanon by Married-Couple Family Poverty
In terms of married-couple family poverty, the demographic groups most similar to Immigrants from Lebanon are Arapaho (6.6%, a difference of 0.080%), Belizean (6.5%, a difference of 0.17%), Immigrants from Barbados (6.5%, a difference of 0.21%), Nepalese (6.5%, a difference of 0.44%), and Salvadoran (6.5%, a difference of 0.61%).
| Demographics | Rating | Rank | Married-Couple Family Poverty |
| Blacks/African Americans | 0.0 /100 | #285 | Tragic 6.5% |
| Guyanese | 0.0 /100 | #286 | Tragic 6.5% |
| Ecuadorians | 0.0 /100 | #287 | Tragic 6.5% |
| Salvadorans | 0.0 /100 | #288 | Tragic 6.5% |
| Nepalese | 0.0 /100 | #289 | Tragic 6.5% |
| Immigrants | Barbados | 0.0 /100 | #290 | Tragic 6.5% |
| Belizeans | 0.0 /100 | #291 | Tragic 6.5% |
| Immigrants | Lebanon | 0.0 /100 | #292 | Tragic 6.6% |
| Arapaho | 0.0 /100 | #293 | Tragic 6.6% |
| Bahamians | 0.0 /100 | #294 | Tragic 6.6% |
| Immigrants | Uzbekistan | 0.0 /100 | #295 | Tragic 6.6% |
| U.S. Virgin Islanders | 0.0 /100 | #296 | Tragic 6.6% |
| Kiowa | 0.0 /100 | #297 | Tragic 6.6% |
| Immigrants | Guyana | 0.0 /100 | #298 | Tragic 6.7% |
| Nicaraguans | 0.0 /100 | #299 | Tragic 6.7% |
Demographics Similar to Osage by Married-Couple Family Poverty
In terms of married-couple family poverty, the demographic groups most similar to Osage are Chippewa (5.4%, a difference of 0.10%), Immigrants from Africa (5.5%, a difference of 0.14%), Immigrants from Costa Rica (5.4%, a difference of 0.19%), French American Indian (5.5%, a difference of 0.45%), and Immigrants from Syria (5.5%, a difference of 0.59%).
| Demographics | Rating | Rank | Married-Couple Family Poverty |
| Uruguayans | 25.0 /100 | #199 | Fair 5.4% |
| Immigrants | Morocco | 24.3 /100 | #200 | Fair 5.4% |
| Lebanese | 24.1 /100 | #201 | Fair 5.4% |
| Immigrants | Middle Africa | 23.8 /100 | #202 | Fair 5.4% |
| Immigrants | Peru | 21.8 /100 | #203 | Fair 5.4% |
| Immigrants | Costa Rica | 19.4 /100 | #204 | Poor 5.4% |
| Chippewa | 18.9 /100 | #205 | Poor 5.4% |
| Osage | 18.4 /100 | #206 | Poor 5.4% |
| Immigrants | Africa | 17.6 /100 | #207 | Poor 5.5% |
| French American Indians | 16.1 /100 | #208 | Poor 5.5% |
| Immigrants | Syria | 15.4 /100 | #209 | Poor 5.5% |
| Immigrants | Micronesia | 14.4 /100 | #210 | Poor 5.5% |
| Nigerians | 14.3 /100 | #211 | Poor 5.5% |
| Immigrants | Thailand | 14.0 /100 | #212 | Poor 5.5% |
| Immigrants | Liberia | 13.3 /100 | #213 | Poor 5.5% |