Immigrants from Lebanon vs Osage Per Capita Income
COMPARE
Immigrants from Lebanon
Osage
Per Capita Income
Per Capita Income Comparison
Immigrants from Lebanon
Osage
$46,938
PER CAPITA INCOME
97.5/ 100
METRIC RATING
100th/ 347
METRIC RANK
$39,568
PER CAPITA INCOME
1.0/ 100
METRIC RATING
253rd/ 347
METRIC RANK
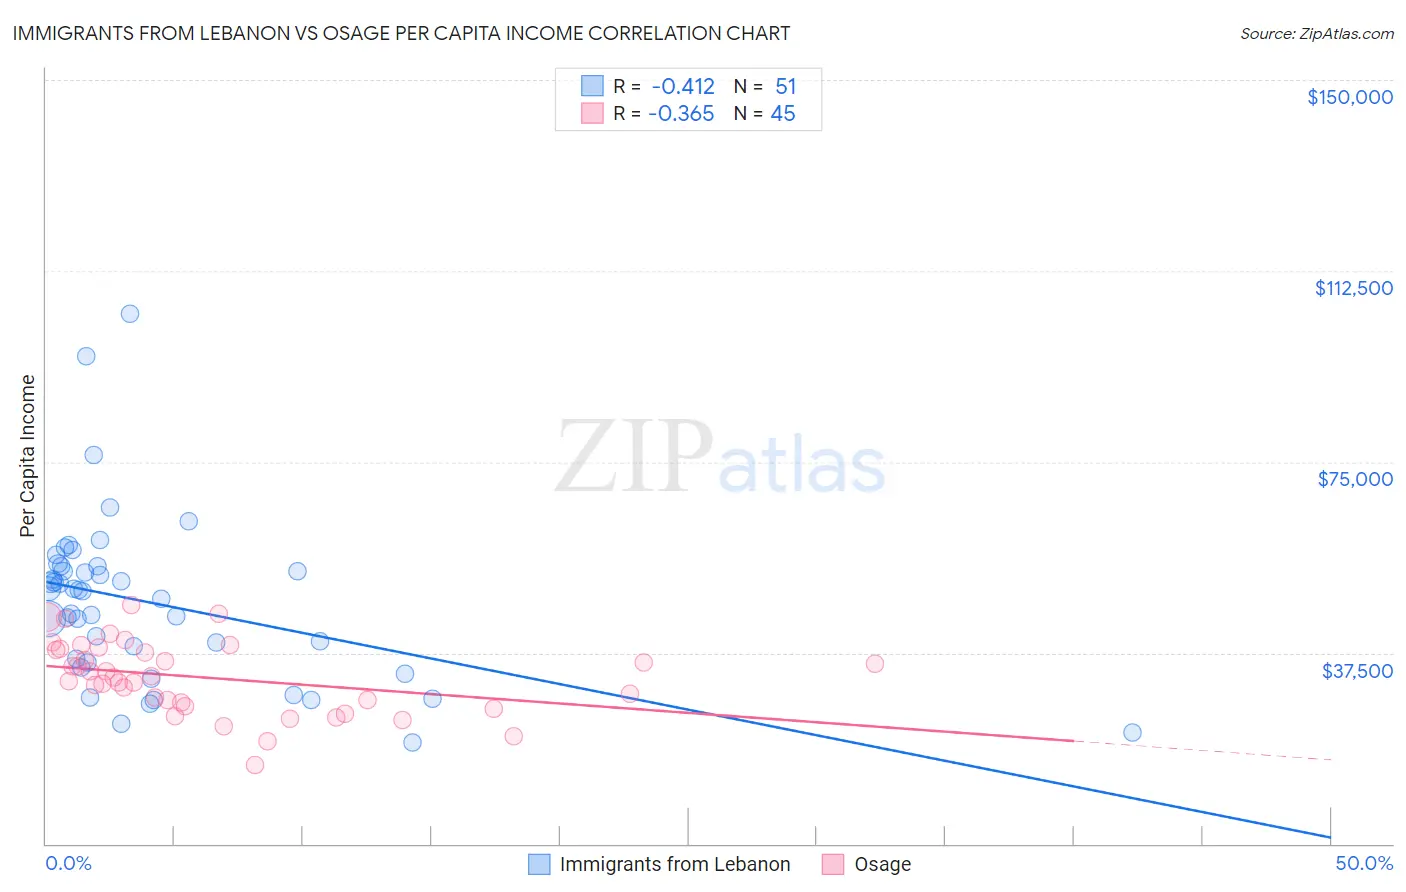
Immigrants from Lebanon vs Osage Per Capita Income Correlation Chart
The statistical analysis conducted on geographies consisting of 217,160,292 people shows a moderate negative correlation between the proportion of Immigrants from Lebanon and per capita income in the United States with a correlation coefficient (R) of -0.412 and weighted average of $46,938. Similarly, the statistical analysis conducted on geographies consisting of 91,808,929 people shows a mild negative correlation between the proportion of Osage and per capita income in the United States with a correlation coefficient (R) of -0.365 and weighted average of $39,568, a difference of 18.6%.
Per Capita Income Correlation Summary
| Measurement | Immigrants from Lebanon | Osage |
| Minimum | $19,973 | $15,396 |
| Maximum | $104,134 | $46,906 |
| Range | $84,161 | $31,510 |
| Mean | $47,317 | $32,578 |
| Median | $49,588 | $32,608 |
| Interquartile 25% (IQ1) | $35,701 | $27,395 |
| Interquartile 75% (IQ3) | $54,451 | $38,257 |
| Interquartile Range (IQR) | $18,750 | $10,862 |
| Standard Deviation (Sample) | $16,286 | $7,093 |
| Standard Deviation (Population) | $16,125 | $7,014 |
Similar Demographics by Per Capita Income
Demographics Similar to Immigrants from Lebanon by Per Capita Income
In terms of per capita income, the demographic groups most similar to Immigrants from Lebanon are Immigrants from Uzbekistan ($46,929, a difference of 0.020%), Immigrants from Western Asia ($46,876, a difference of 0.13%), Laotian ($47,041, a difference of 0.22%), Syrian ($46,837, a difference of 0.22%), and Immigrants from Pakistan ($47,084, a difference of 0.31%).
| Demographics | Rating | Rank | Per Capita Income |
| Immigrants | Zimbabwe | 98.5 /100 | #93 | Exceptional $47,394 |
| Albanians | 98.5 /100 | #94 | Exceptional $47,379 |
| Immigrants | Egypt | 98.5 /100 | #95 | Exceptional $47,361 |
| Alsatians | 98.3 /100 | #96 | Exceptional $47,284 |
| Carpatho Rusyns | 98.2 /100 | #97 | Exceptional $47,248 |
| Immigrants | Pakistan | 97.9 /100 | #98 | Exceptional $47,084 |
| Laotians | 97.8 /100 | #99 | Exceptional $47,041 |
| Immigrants | Lebanon | 97.5 /100 | #100 | Exceptional $46,938 |
| Immigrants | Uzbekistan | 97.5 /100 | #101 | Exceptional $46,929 |
| Immigrants | Western Asia | 97.4 /100 | #102 | Exceptional $46,876 |
| Syrians | 97.2 /100 | #103 | Exceptional $46,837 |
| Brazilians | 96.8 /100 | #104 | Exceptional $46,700 |
| British | 96.3 /100 | #105 | Exceptional $46,571 |
| Ethiopians | 96.3 /100 | #106 | Exceptional $46,569 |
| Serbians | 96.2 /100 | #107 | Exceptional $46,551 |
Demographics Similar to Osage by Per Capita Income
In terms of per capita income, the demographic groups most similar to Osage are Alaska Native ($39,558, a difference of 0.020%), Immigrants from the Azores ($39,608, a difference of 0.10%), Immigrants from Middle Africa ($39,529, a difference of 0.10%), Hawaiian ($39,403, a difference of 0.42%), and Nicaraguan ($39,372, a difference of 0.50%).
| Demographics | Rating | Rank | Per Capita Income |
| Cree | 1.7 /100 | #246 | Tragic $40,056 |
| Immigrants | Somalia | 1.6 /100 | #247 | Tragic $39,974 |
| Cape Verdeans | 1.5 /100 | #248 | Tragic $39,935 |
| Japanese | 1.4 /100 | #249 | Tragic $39,870 |
| Immigrants | Burma/Myanmar | 1.3 /100 | #250 | Tragic $39,827 |
| Samoans | 1.3 /100 | #251 | Tragic $39,826 |
| Immigrants | Azores | 1.0 /100 | #252 | Tragic $39,608 |
| Osage | 1.0 /100 | #253 | Tragic $39,568 |
| Alaska Natives | 1.0 /100 | #254 | Tragic $39,558 |
| Immigrants | Middle Africa | 1.0 /100 | #255 | Tragic $39,529 |
| Hawaiians | 0.8 /100 | #256 | Tragic $39,403 |
| Nicaraguans | 0.8 /100 | #257 | Tragic $39,372 |
| Jamaicans | 0.7 /100 | #258 | Tragic $39,231 |
| Malaysians | 0.7 /100 | #259 | Tragic $39,194 |
| Alaskan Athabascans | 0.6 /100 | #260 | Tragic $39,163 |