Immigrants from Lebanon vs Cambodian Child Poverty Among Girls Under 16
COMPARE
Immigrants from Lebanon
Cambodian
Child Poverty Among Girls Under 16
Child Poverty Among Girls Under 16 Comparison
Immigrants from Lebanon
Cambodians
17.1%
CHILD POVERTY AMONG GIRLS UNDER 16
22.6/ 100
METRIC RATING
198th/ 347
METRIC RANK
14.4%
CHILD POVERTY AMONG GIRLS UNDER 16
98.7/ 100
METRIC RATING
61st/ 347
METRIC RANK
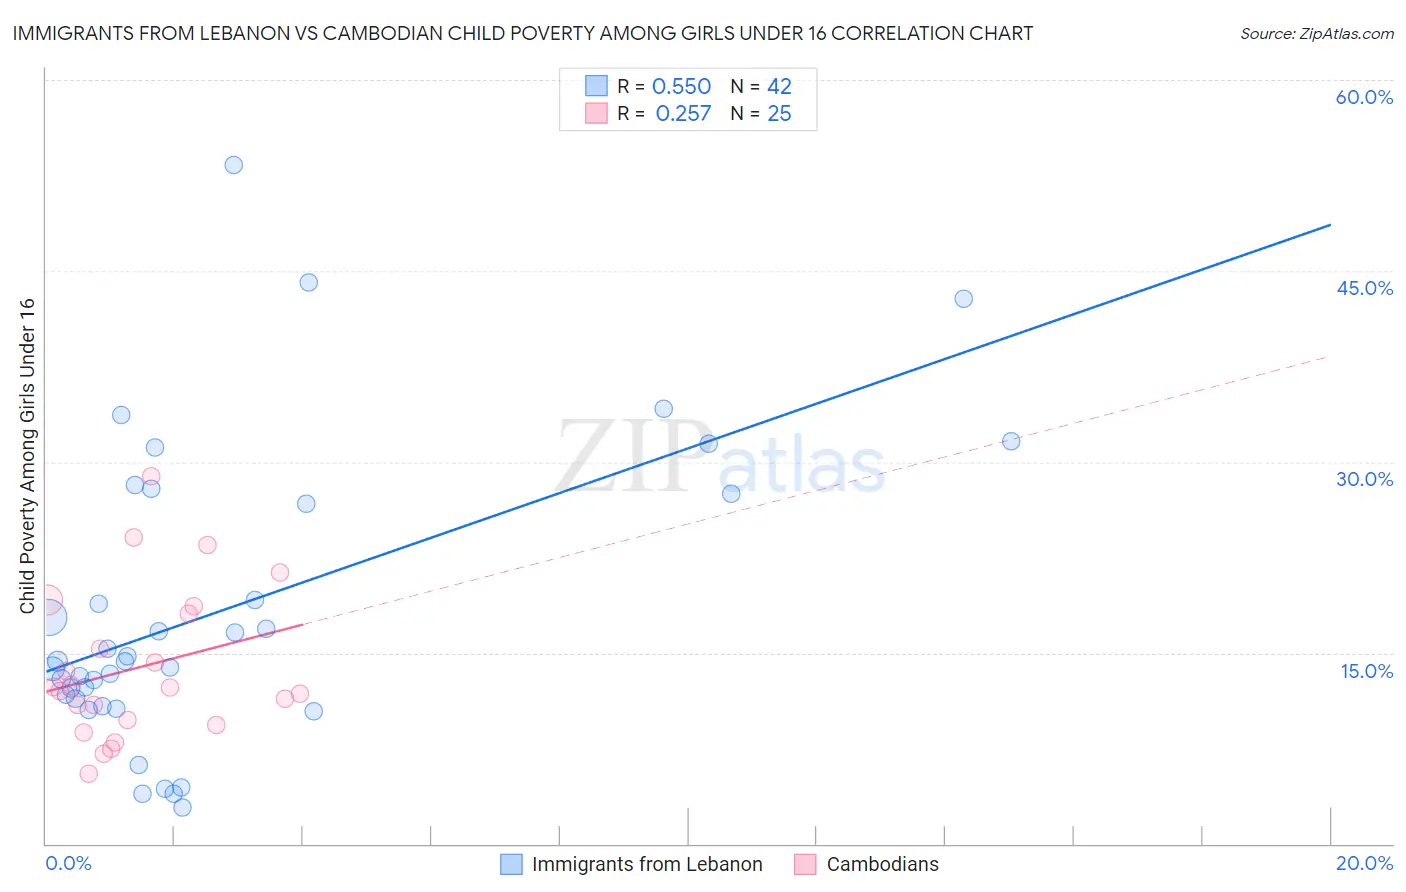
Immigrants from Lebanon vs Cambodian Child Poverty Among Girls Under 16 Correlation Chart
The statistical analysis conducted on geographies consisting of 214,720,358 people shows a substantial positive correlation between the proportion of Immigrants from Lebanon and poverty level among girls under the age of 16 in the United States with a correlation coefficient (R) of 0.550 and weighted average of 17.1%. Similarly, the statistical analysis conducted on geographies consisting of 102,087,576 people shows a weak positive correlation between the proportion of Cambodians and poverty level among girls under the age of 16 in the United States with a correlation coefficient (R) of 0.257 and weighted average of 14.4%, a difference of 18.3%.
Child Poverty Among Girls Under 16 Correlation Summary
| Measurement | Immigrants from Lebanon | Cambodian |
| Minimum | 2.9% | 5.5% |
| Maximum | 53.3% | 28.9% |
| Range | 50.5% | 23.4% |
| Mean | 18.4% | 13.9% |
| Median | 14.3% | 12.2% |
| Interquartile 25% (IQ1) | 11.4% | 9.5% |
| Interquartile 75% (IQ3) | 27.5% | 18.4% |
| Interquartile Range (IQR) | 16.1% | 8.8% |
| Standard Deviation (Sample) | 11.7% | 5.9% |
| Standard Deviation (Population) | 11.6% | 5.8% |
Similar Demographics by Child Poverty Among Girls Under 16
Demographics Similar to Immigrants from Lebanon by Child Poverty Among Girls Under 16
In terms of child poverty among girls under 16, the demographic groups most similar to Immigrants from Lebanon are Immigrants from Afghanistan (17.1%, a difference of 0.020%), Immigrants from Uzbekistan (17.1%, a difference of 0.18%), Spaniard (17.0%, a difference of 0.35%), Celtic (17.0%, a difference of 0.41%), and Immigrants from Costa Rica (17.0%, a difference of 0.46%).
| Demographics | Rating | Rank | Child Poverty Among Girls Under 16 |
| Immigrants | Azores | 31.3 /100 | #191 | Fair 16.8% |
| Immigrants | Uganda | 31.3 /100 | #192 | Fair 16.8% |
| Aleuts | 28.7 /100 | #193 | Fair 16.9% |
| Spanish | 28.6 /100 | #194 | Fair 16.9% |
| Immigrants | Costa Rica | 25.6 /100 | #195 | Fair 17.0% |
| Celtics | 25.2 /100 | #196 | Fair 17.0% |
| Spaniards | 24.9 /100 | #197 | Fair 17.0% |
| Immigrants | Lebanon | 22.6 /100 | #198 | Fair 17.1% |
| Immigrants | Afghanistan | 22.4 /100 | #199 | Fair 17.1% |
| Immigrants | Uzbekistan | 21.5 /100 | #200 | Fair 17.1% |
| Immigrants | Kenya | 17.8 /100 | #201 | Poor 17.2% |
| Immigrants | Sierra Leone | 17.6 /100 | #202 | Poor 17.2% |
| Ugandans | 17.5 /100 | #203 | Poor 17.2% |
| Iraqis | 13.0 /100 | #204 | Poor 17.4% |
| Immigrants | Cameroon | 12.6 /100 | #205 | Poor 17.4% |
Demographics Similar to Cambodians by Child Poverty Among Girls Under 16
In terms of child poverty among girls under 16, the demographic groups most similar to Cambodians are Polish (14.4%, a difference of 0.0%), Scandinavian (14.4%, a difference of 0.11%), Immigrants from Europe (14.4%, a difference of 0.16%), Zimbabwean (14.4%, a difference of 0.20%), and Immigrants from Bulgaria (14.4%, a difference of 0.26%).
| Demographics | Rating | Rank | Child Poverty Among Girls Under 16 |
| Estonians | 98.9 /100 | #54 | Exceptional 14.3% |
| Immigrants | Romania | 98.9 /100 | #55 | Exceptional 14.3% |
| Immigrants | Indonesia | 98.9 /100 | #56 | Exceptional 14.4% |
| Immigrants | Serbia | 98.9 /100 | #57 | Exceptional 14.4% |
| Immigrants | Bulgaria | 98.8 /100 | #58 | Exceptional 14.4% |
| Zimbabweans | 98.8 /100 | #59 | Exceptional 14.4% |
| Poles | 98.7 /100 | #60 | Exceptional 14.4% |
| Cambodians | 98.7 /100 | #61 | Exceptional 14.4% |
| Scandinavians | 98.7 /100 | #62 | Exceptional 14.4% |
| Immigrants | Europe | 98.7 /100 | #63 | Exceptional 14.4% |
| Immigrants | Philippines | 98.6 /100 | #64 | Exceptional 14.4% |
| Immigrants | Sweden | 98.6 /100 | #65 | Exceptional 14.5% |
| Immigrants | Belgium | 98.5 /100 | #66 | Exceptional 14.5% |
| Laotians | 98.4 /100 | #67 | Exceptional 14.5% |
| Immigrants | Argentina | 98.3 /100 | #68 | Exceptional 14.6% |