Immigrants from Lebanon vs Barbadian Family Poverty
COMPARE
Immigrants from Lebanon
Barbadian
Family Poverty
Family Poverty Comparison
Immigrants from Lebanon
Barbadians
9.4%
FAMILY POVERTY
18.9/ 100
METRIC RATING
204th/ 347
METRIC RANK
11.3%
FAMILY POVERTY
0.0/ 100
METRIC RATING
285th/ 347
METRIC RANK
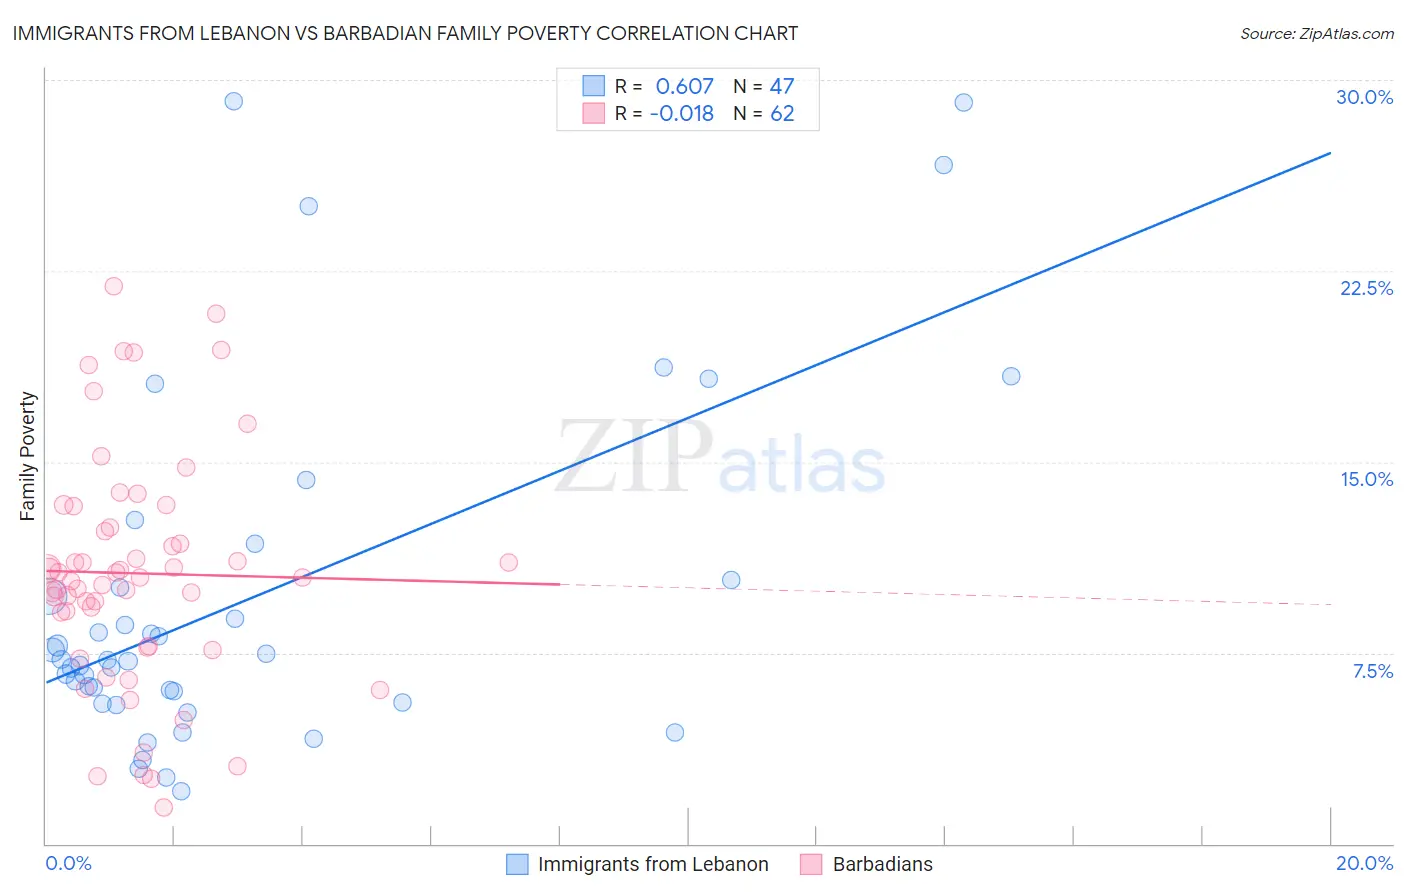
Immigrants from Lebanon vs Barbadian Family Poverty Correlation Chart
The statistical analysis conducted on geographies consisting of 216,928,254 people shows a significant positive correlation between the proportion of Immigrants from Lebanon and poverty level among families in the United States with a correlation coefficient (R) of 0.607 and weighted average of 9.4%. Similarly, the statistical analysis conducted on geographies consisting of 141,196,008 people shows no correlation between the proportion of Barbadians and poverty level among families in the United States with a correlation coefficient (R) of -0.018 and weighted average of 11.3%, a difference of 20.3%.
Family Poverty Correlation Summary
| Measurement | Immigrants from Lebanon | Barbadian |
| Minimum | 2.1% | 1.4% |
| Maximum | 29.2% | 21.9% |
| Range | 27.1% | 20.5% |
| Mean | 9.6% | 10.6% |
| Median | 7.2% | 10.5% |
| Interquartile 25% (IQ1) | 5.6% | 7.7% |
| Interquartile 75% (IQ3) | 10.4% | 12.4% |
| Interquartile Range (IQR) | 4.8% | 4.7% |
| Standard Deviation (Sample) | 6.8% | 4.6% |
| Standard Deviation (Population) | 6.8% | 4.5% |
Similar Demographics by Family Poverty
Demographics Similar to Immigrants from Lebanon by Family Poverty
In terms of family poverty, the demographic groups most similar to Immigrants from Lebanon are German Russian (9.4%, a difference of 0.10%), Immigrants from Sierra Leone (9.4%, a difference of 0.14%), Aleut (9.5%, a difference of 0.19%), Immigrants from South America (9.5%, a difference of 0.20%), and Immigrants from Portugal (9.4%, a difference of 0.31%).
| Demographics | Rating | Rank | Family Poverty |
| Immigrants | Colombia | 24.4 /100 | #197 | Fair 9.3% |
| Iraqis | 24.2 /100 | #198 | Fair 9.3% |
| Spaniards | 22.8 /100 | #199 | Fair 9.4% |
| Immigrants | Costa Rica | 21.7 /100 | #200 | Fair 9.4% |
| Immigrants | Portugal | 20.5 /100 | #201 | Fair 9.4% |
| Immigrants | Sierra Leone | 19.6 /100 | #202 | Poor 9.4% |
| German Russians | 19.4 /100 | #203 | Poor 9.4% |
| Immigrants | Lebanon | 18.9 /100 | #204 | Poor 9.4% |
| Aleuts | 18.0 /100 | #205 | Poor 9.5% |
| Immigrants | South America | 18.0 /100 | #206 | Poor 9.5% |
| Sierra Leoneans | 15.6 /100 | #207 | Poor 9.5% |
| Immigrants | Eastern Africa | 15.1 /100 | #208 | Poor 9.5% |
| Immigrants | Uruguay | 14.0 /100 | #209 | Poor 9.5% |
| Alsatians | 11.3 /100 | #210 | Poor 9.6% |
| Malaysians | 10.6 /100 | #211 | Poor 9.6% |
Demographics Similar to Barbadians by Family Poverty
In terms of family poverty, the demographic groups most similar to Barbadians are Yaqui (11.3%, a difference of 0.080%), Indonesian (11.3%, a difference of 0.20%), Immigrants from Cuba (11.3%, a difference of 0.24%), Immigrants from West Indies (11.3%, a difference of 0.50%), and Belizean (11.3%, a difference of 0.77%).
| Demographics | Rating | Rank | Family Poverty |
| Guyanese | 0.1 /100 | #278 | Tragic 11.2% |
| Blackfeet | 0.0 /100 | #279 | Tragic 11.3% |
| Belizeans | 0.0 /100 | #280 | Tragic 11.3% |
| Immigrants | West Indies | 0.0 /100 | #281 | Tragic 11.3% |
| Immigrants | Cuba | 0.0 /100 | #282 | Tragic 11.3% |
| Indonesians | 0.0 /100 | #283 | Tragic 11.3% |
| Yaqui | 0.0 /100 | #284 | Tragic 11.3% |
| Barbadians | 0.0 /100 | #285 | Tragic 11.3% |
| Senegalese | 0.0 /100 | #286 | Tragic 11.5% |
| Vietnamese | 0.0 /100 | #287 | Tragic 11.5% |
| Immigrants | Belize | 0.0 /100 | #288 | Tragic 11.5% |
| Immigrants | Barbados | 0.0 /100 | #289 | Tragic 11.5% |
| West Indians | 0.0 /100 | #290 | Tragic 11.5% |
| Haitians | 0.0 /100 | #291 | Tragic 11.5% |
| Immigrants | Somalia | 0.0 /100 | #292 | Tragic 11.5% |