Immigrants from Latin America vs Immigrants from Congo Unemployment Among Ages 30 to 34 years
COMPARE
Immigrants from Latin America
Immigrants from Congo
Unemployment Among Ages 30 to 34 years
Unemployment Among Ages 30 to 34 years Comparison
Immigrants from Latin America
Immigrants from Congo
6.1%
UNEMPLOYMENT AMONG AGES 30 TO 34 YEARS
0.1/ 100
METRIC RATING
260th/ 347
METRIC RANK
5.1%
UNEMPLOYMENT AMONG AGES 30 TO 34 YEARS
98.4/ 100
METRIC RATING
46th/ 347
METRIC RANK
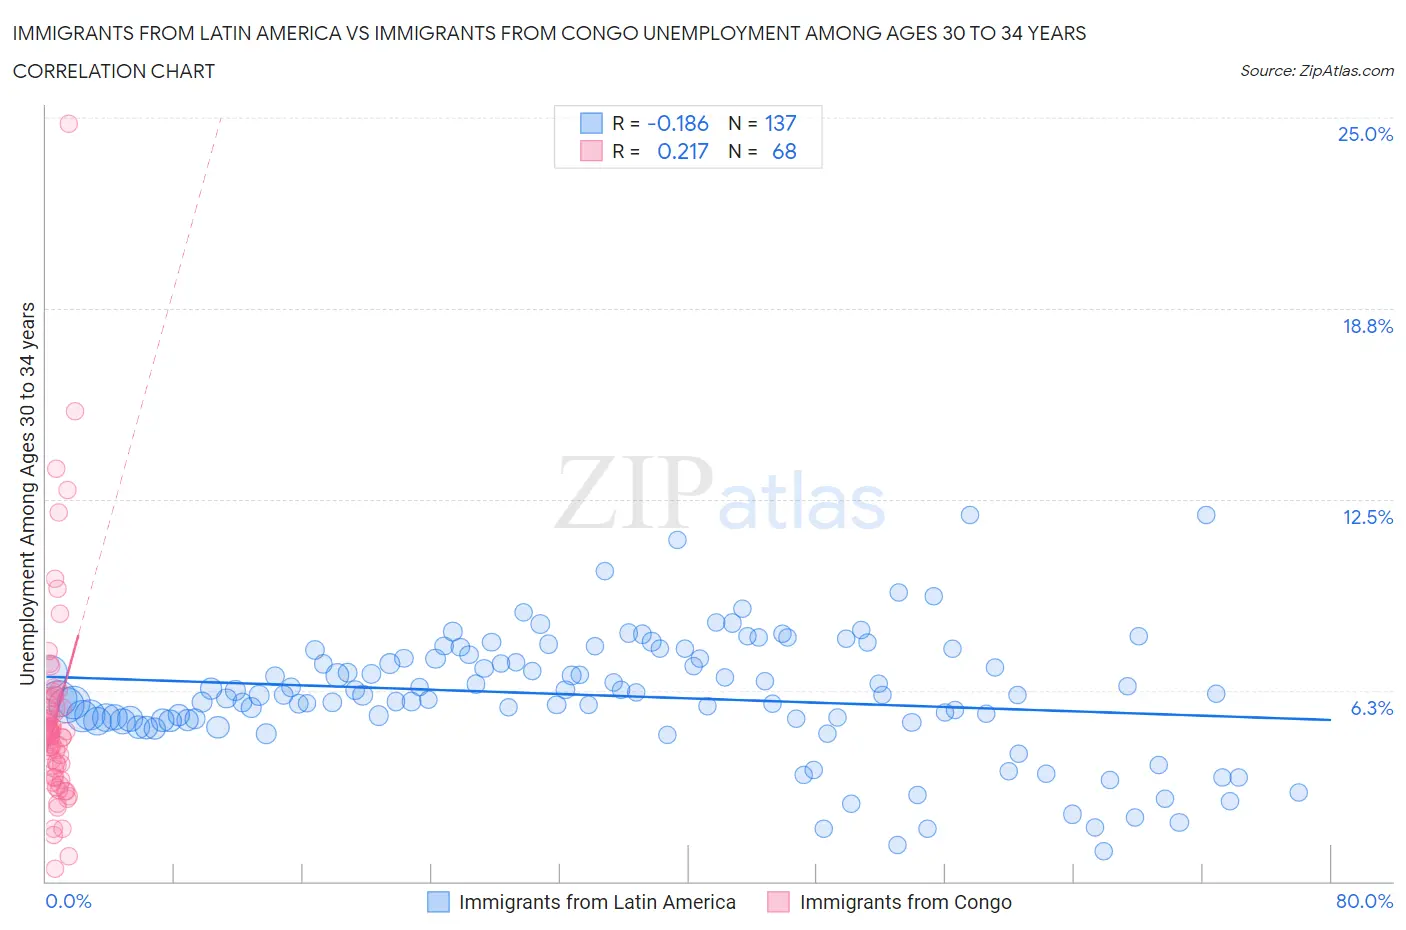
Immigrants from Latin America vs Immigrants from Congo Unemployment Among Ages 30 to 34 years Correlation Chart
The statistical analysis conducted on geographies consisting of 495,403,747 people shows a poor negative correlation between the proportion of Immigrants from Latin America and unemployment rate among population between the ages 30 and 34 in the United States with a correlation coefficient (R) of -0.186 and weighted average of 6.1%. Similarly, the statistical analysis conducted on geographies consisting of 91,108,629 people shows a weak positive correlation between the proportion of Immigrants from Congo and unemployment rate among population between the ages 30 and 34 in the United States with a correlation coefficient (R) of 0.217 and weighted average of 5.1%, a difference of 21.3%.
Unemployment Among Ages 30 to 34 years Correlation Summary
| Measurement | Immigrants from Latin America | Immigrants from Congo |
| Minimum | 1.0% | 0.40% |
| Maximum | 12.0% | 24.8% |
| Range | 11.0% | 24.4% |
| Mean | 6.1% | 5.4% |
| Median | 6.1% | 4.7% |
| Interquartile 25% (IQ1) | 5.3% | 3.4% |
| Interquartile 75% (IQ3) | 7.3% | 5.7% |
| Interquartile Range (IQR) | 2.0% | 2.3% |
| Standard Deviation (Sample) | 2.0% | 3.7% |
| Standard Deviation (Population) | 2.0% | 3.6% |
Similar Demographics by Unemployment Among Ages 30 to 34 years
Demographics Similar to Immigrants from Latin America by Unemployment Among Ages 30 to 34 years
In terms of unemployment among ages 30 to 34 years, the demographic groups most similar to Immigrants from Latin America are Immigrants from Western Africa (6.2%, a difference of 0.15%), Haitian (6.1%, a difference of 0.22%), Mexican (6.1%, a difference of 0.30%), Immigrants from Central America (6.2%, a difference of 0.33%), and Immigrants from Sierra Leone (6.1%, a difference of 0.36%).
| Demographics | Rating | Rank | Unemployment Among Ages 30 to 34 years |
| Immigrants | Nonimmigrants | 0.2 /100 | #253 | Tragic 6.1% |
| Armenians | 0.1 /100 | #254 | Tragic 6.1% |
| Immigrants | Portugal | 0.1 /100 | #255 | Tragic 6.1% |
| Immigrants | Ghana | 0.1 /100 | #256 | Tragic 6.1% |
| Immigrants | Sierra Leone | 0.1 /100 | #257 | Tragic 6.1% |
| Mexicans | 0.1 /100 | #258 | Tragic 6.1% |
| Haitians | 0.1 /100 | #259 | Tragic 6.1% |
| Immigrants | Latin America | 0.1 /100 | #260 | Tragic 6.1% |
| Immigrants | Western Africa | 0.1 /100 | #261 | Tragic 6.2% |
| Immigrants | Central America | 0.1 /100 | #262 | Tragic 6.2% |
| Spanish Americans | 0.0 /100 | #263 | Tragic 6.2% |
| Chickasaw | 0.0 /100 | #264 | Tragic 6.2% |
| Americans | 0.0 /100 | #265 | Tragic 6.2% |
| Seminole | 0.0 /100 | #266 | Tragic 6.2% |
| Immigrants | Mexico | 0.0 /100 | #267 | Tragic 6.2% |
Demographics Similar to Immigrants from Congo by Unemployment Among Ages 30 to 34 years
In terms of unemployment among ages 30 to 34 years, the demographic groups most similar to Immigrants from Congo are Cypriot (5.1%, a difference of 0.030%), Assyrian/Chaldean/Syriac (5.1%, a difference of 0.040%), Immigrants from Malaysia (5.1%, a difference of 0.17%), Puget Sound Salish (5.1%, a difference of 0.24%), and Turkish (5.1%, a difference of 0.27%).
| Demographics | Rating | Rank | Unemployment Among Ages 30 to 34 years |
| Fijians | 99.0 /100 | #39 | Exceptional 5.0% |
| Immigrants | Vietnam | 98.9 /100 | #40 | Exceptional 5.0% |
| Immigrants | Eastern Africa | 98.9 /100 | #41 | Exceptional 5.0% |
| Immigrants | Hong Kong | 98.8 /100 | #42 | Exceptional 5.0% |
| Soviet Union | 98.8 /100 | #43 | Exceptional 5.0% |
| Immigrants | Belgium | 98.7 /100 | #44 | Exceptional 5.1% |
| Yugoslavians | 98.6 /100 | #45 | Exceptional 5.1% |
| Immigrants | Congo | 98.4 /100 | #46 | Exceptional 5.1% |
| Cypriots | 98.4 /100 | #47 | Exceptional 5.1% |
| Assyrians/Chaldeans/Syriacs | 98.4 /100 | #48 | Exceptional 5.1% |
| Immigrants | Malaysia | 98.3 /100 | #49 | Exceptional 5.1% |
| Puget Sound Salish | 98.2 /100 | #50 | Exceptional 5.1% |
| Turks | 98.2 /100 | #51 | Exceptional 5.1% |
| Immigrants | Burma/Myanmar | 98.1 /100 | #52 | Exceptional 5.1% |
| Cubans | 98.1 /100 | #53 | Exceptional 5.1% |