Immigrants from Latin America vs Paiute Single Male Poverty
COMPARE
Immigrants from Latin America
Paiute
Single Male Poverty
Single Male Poverty Comparison
Immigrants from Latin America
Paiute
13.5%
SINGLE MALE POVERTY
1.3/ 100
METRIC RATING
245th/ 347
METRIC RANK
19.3%
SINGLE MALE POVERTY
0.0/ 100
METRIC RATING
331st/ 347
METRIC RANK
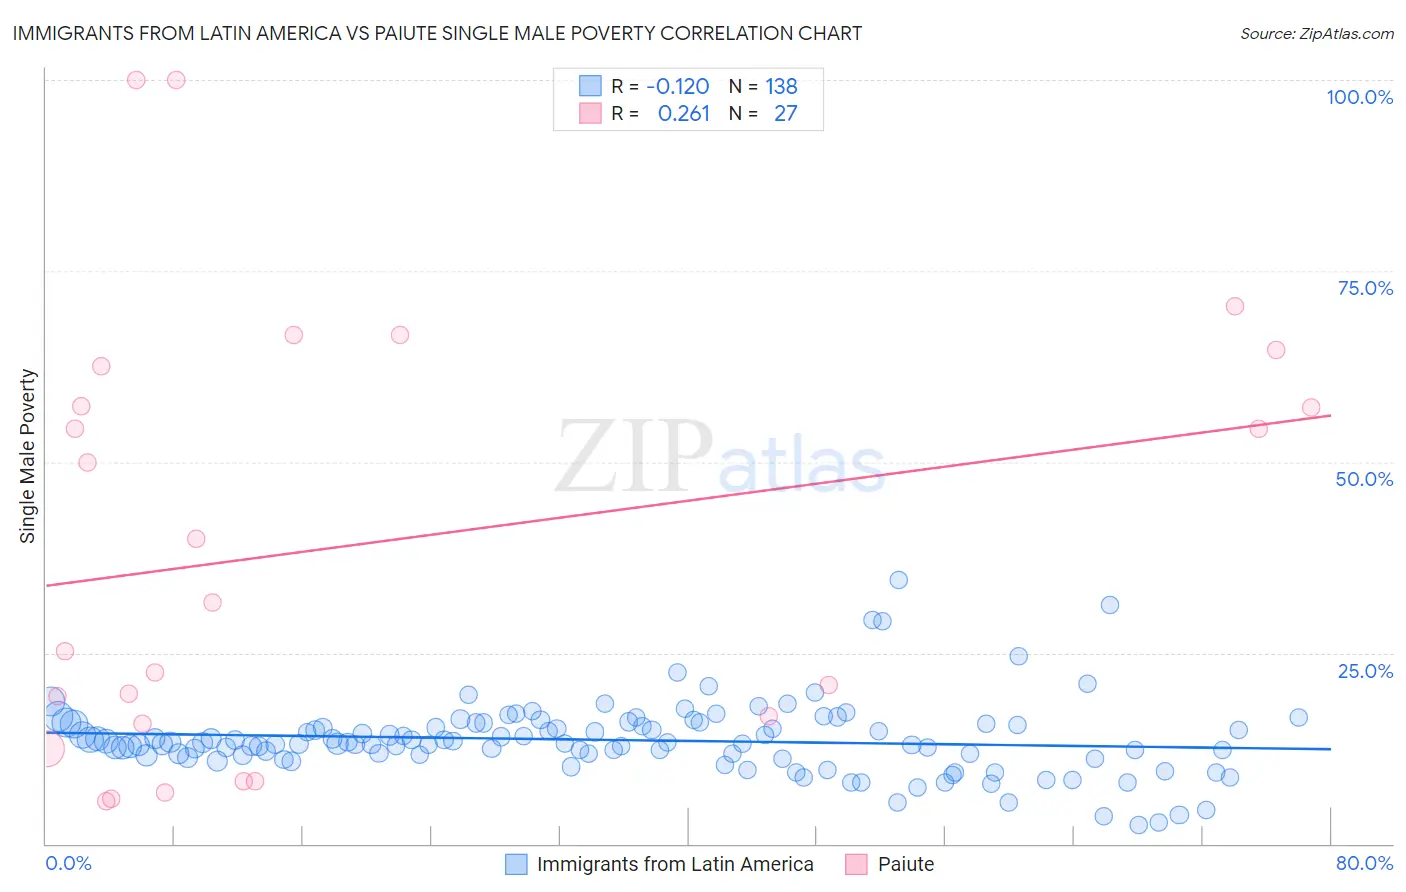
Immigrants from Latin America vs Paiute Single Male Poverty Correlation Chart
The statistical analysis conducted on geographies consisting of 467,663,456 people shows a poor negative correlation between the proportion of Immigrants from Latin America and poverty level among single males in the United States with a correlation coefficient (R) of -0.120 and weighted average of 13.5%. Similarly, the statistical analysis conducted on geographies consisting of 56,714,476 people shows a weak positive correlation between the proportion of Paiute and poverty level among single males in the United States with a correlation coefficient (R) of 0.261 and weighted average of 19.3%, a difference of 42.7%.
Single Male Poverty Correlation Summary
| Measurement | Immigrants from Latin America | Paiute |
| Minimum | 2.4% | 5.6% |
| Maximum | 34.5% | 100.0% |
| Range | 32.0% | 94.4% |
| Mean | 13.6% | 39.3% |
| Median | 13.2% | 31.7% |
| Interquartile 25% (IQ1) | 11.6% | 15.8% |
| Interquartile 75% (IQ3) | 15.6% | 62.5% |
| Interquartile Range (IQR) | 4.1% | 46.7% |
| Standard Deviation (Sample) | 4.8% | 28.4% |
| Standard Deviation (Population) | 4.8% | 27.9% |
Similar Demographics by Single Male Poverty
Demographics Similar to Immigrants from Latin America by Single Male Poverty
In terms of single male poverty, the demographic groups most similar to Immigrants from Latin America are Immigrants from Micronesia (13.5%, a difference of 0.10%), Belgian (13.5%, a difference of 0.12%), Czech (13.5%, a difference of 0.14%), Immigrants from Senegal (13.5%, a difference of 0.26%), and Spanish (13.6%, a difference of 0.38%).
| Demographics | Rating | Rank | Single Male Poverty |
| Immigrants | Ghana | 3.2 /100 | #238 | Tragic 13.4% |
| Czechoslovakians | 3.0 /100 | #239 | Tragic 13.4% |
| Belizeans | 2.3 /100 | #240 | Tragic 13.4% |
| Immigrants | Germany | 2.1 /100 | #241 | Tragic 13.4% |
| Carpatho Rusyns | 2.1 /100 | #242 | Tragic 13.4% |
| Barbadians | 2.1 /100 | #243 | Tragic 13.4% |
| Immigrants | Senegal | 1.7 /100 | #244 | Tragic 13.5% |
| Immigrants | Latin America | 1.3 /100 | #245 | Tragic 13.5% |
| Immigrants | Micronesia | 1.2 /100 | #246 | Tragic 13.5% |
| Belgians | 1.2 /100 | #247 | Tragic 13.5% |
| Czechs | 1.2 /100 | #248 | Tragic 13.5% |
| Spanish | 1.0 /100 | #249 | Tragic 13.6% |
| Immigrants | Somalia | 1.0 /100 | #250 | Tragic 13.6% |
| Immigrants | Zaire | 0.9 /100 | #251 | Tragic 13.6% |
| Finns | 0.9 /100 | #252 | Tragic 13.6% |
Demographics Similar to Paiute by Single Male Poverty
In terms of single male poverty, the demographic groups most similar to Paiute are Cajun (19.1%, a difference of 1.1%), Native/Alaskan (19.6%, a difference of 1.7%), Inupiat (20.0%, a difference of 3.6%), Pima (20.2%, a difference of 4.4%), and Colville (18.4%, a difference of 4.6%).
| Demographics | Rating | Rank | Single Male Poverty |
| Immigrants | Yemen | 0.0 /100 | #324 | Tragic 16.9% |
| Choctaw | 0.0 /100 | #325 | Tragic 17.0% |
| Central American Indians | 0.0 /100 | #326 | Tragic 17.2% |
| Menominee | 0.0 /100 | #327 | Tragic 17.7% |
| Kiowa | 0.0 /100 | #328 | Tragic 18.3% |
| Colville | 0.0 /100 | #329 | Tragic 18.4% |
| Cajuns | 0.0 /100 | #330 | Tragic 19.1% |
| Paiute | 0.0 /100 | #331 | Tragic 19.3% |
| Natives/Alaskans | 0.0 /100 | #332 | Tragic 19.6% |
| Inupiat | 0.0 /100 | #333 | Tragic 20.0% |
| Pima | 0.0 /100 | #334 | Tragic 20.2% |
| Yuman | 0.0 /100 | #335 | Tragic 21.3% |
| Tohono O'odham | 0.0 /100 | #336 | Tragic 21.6% |
| Apache | 0.0 /100 | #337 | Tragic 21.6% |
| Pueblo | 0.0 /100 | #338 | Tragic 21.6% |