Immigrants from Laos vs Lumbee Male Unemployment
COMPARE
Immigrants from Laos
Lumbee
Male Unemployment
Male Unemployment Comparison
Immigrants from Laos
Lumbee
5.4%
MALE UNEMPLOYMENT
13.0/ 100
METRIC RATING
203rd/ 347
METRIC RANK
6.9%
MALE UNEMPLOYMENT
0.0/ 100
METRIC RATING
312th/ 347
METRIC RANK
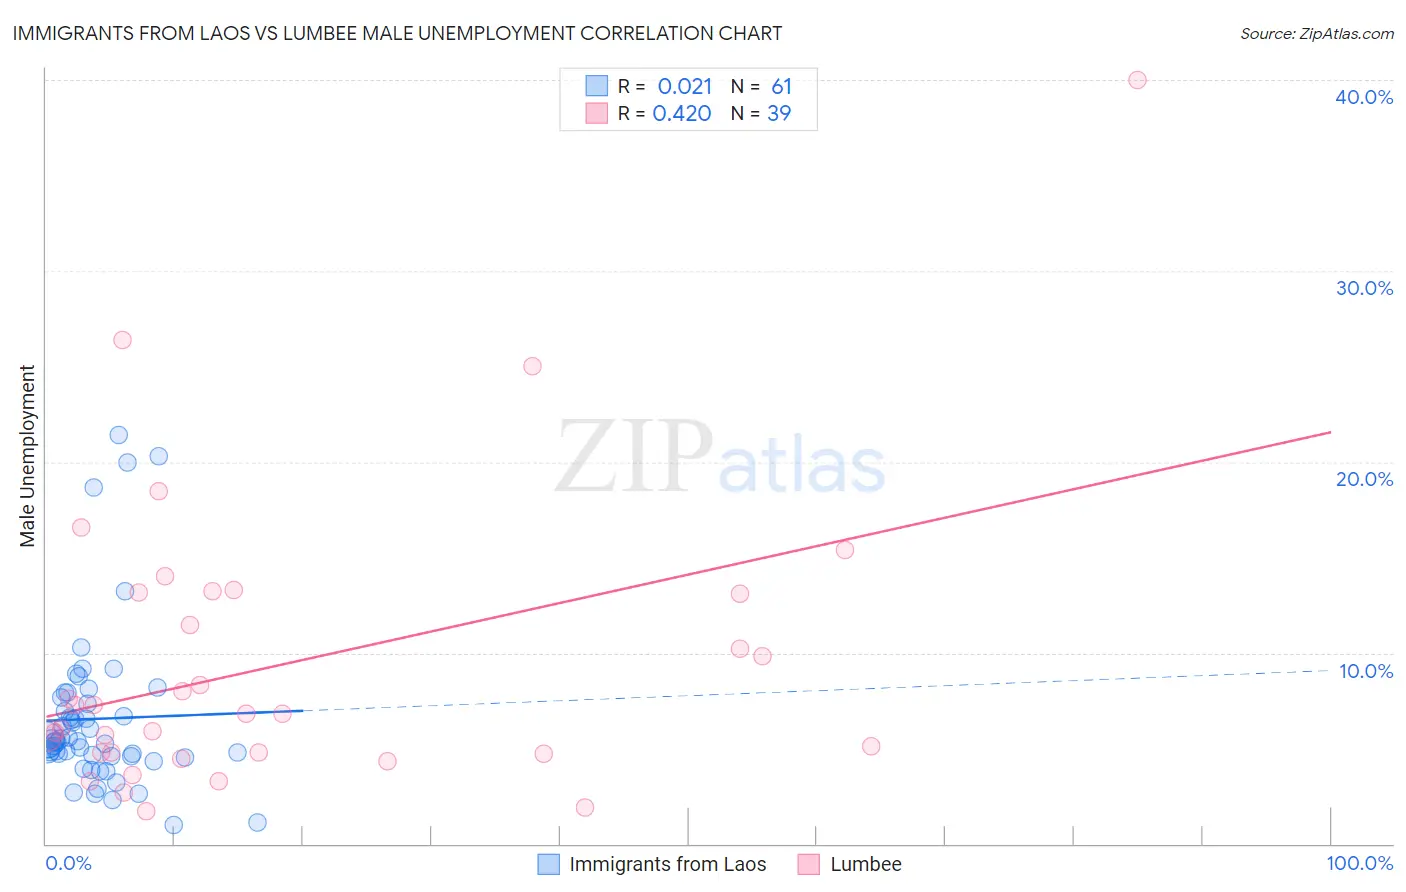
Immigrants from Laos vs Lumbee Male Unemployment Correlation Chart
The statistical analysis conducted on geographies consisting of 201,122,533 people shows no correlation between the proportion of Immigrants from Laos and unemployment rate among males in the United States with a correlation coefficient (R) of 0.021 and weighted average of 5.4%. Similarly, the statistical analysis conducted on geographies consisting of 92,069,666 people shows a moderate positive correlation between the proportion of Lumbee and unemployment rate among males in the United States with a correlation coefficient (R) of 0.420 and weighted average of 6.9%, a difference of 27.4%.
Male Unemployment Correlation Summary
| Measurement | Immigrants from Laos | Lumbee |
| Minimum | 1.0% | 1.7% |
| Maximum | 21.4% | 40.0% |
| Range | 20.4% | 38.3% |
| Mean | 6.5% | 9.5% |
| Median | 5.4% | 6.8% |
| Interquartile 25% (IQ1) | 4.6% | 4.8% |
| Interquartile 75% (IQ3) | 7.5% | 13.1% |
| Interquartile Range (IQR) | 2.9% | 8.4% |
| Standard Deviation (Sample) | 4.2% | 7.7% |
| Standard Deviation (Population) | 4.2% | 7.6% |
Similar Demographics by Male Unemployment
Demographics Similar to Immigrants from Laos by Male Unemployment
In terms of male unemployment, the demographic groups most similar to Immigrants from Laos are Nonimmigrants (5.4%, a difference of 0.010%), Immigrants from Philippines (5.4%, a difference of 0.050%), Immigrants from Zaire (5.4%, a difference of 0.080%), Guamanian/Chamorro (5.4%, a difference of 0.090%), and Immigrants from Greece (5.4%, a difference of 0.18%).
| Demographics | Rating | Rank | Male Unemployment |
| Albanians | 17.3 /100 | #196 | Poor 5.4% |
| Alsatians | 16.7 /100 | #197 | Poor 5.4% |
| Immigrants | Thailand | 14.7 /100 | #198 | Poor 5.4% |
| Immigrants | Greece | 14.5 /100 | #199 | Poor 5.4% |
| Immigrants | Zaire | 13.7 /100 | #200 | Poor 5.4% |
| Immigrants | Philippines | 13.5 /100 | #201 | Poor 5.4% |
| Immigrants | Nonimmigrants | 13.1 /100 | #202 | Poor 5.4% |
| Immigrants | Laos | 13.0 /100 | #203 | Poor 5.4% |
| Guamanians/Chamorros | 12.3 /100 | #204 | Poor 5.4% |
| Immigrants | Costa Rica | 11.4 /100 | #205 | Poor 5.5% |
| Immigrants | Ukraine | 9.9 /100 | #206 | Tragic 5.5% |
| Immigrants | Syria | 9.3 /100 | #207 | Tragic 5.5% |
| Immigrants | Lebanon | 8.6 /100 | #208 | Tragic 5.5% |
| Immigrants | Middle Africa | 8.3 /100 | #209 | Tragic 5.5% |
| South American Indians | 7.6 /100 | #210 | Tragic 5.5% |
Demographics Similar to Lumbee by Male Unemployment
In terms of male unemployment, the demographic groups most similar to Lumbee are Immigrants from Armenia (6.9%, a difference of 0.20%), Black/African American (6.9%, a difference of 0.52%), Immigrants from Dominica (7.0%, a difference of 1.0%), Barbadian (6.9%, a difference of 1.2%), and Aleut (6.8%, a difference of 1.6%).
| Demographics | Rating | Rank | Male Unemployment |
| Trinidadians and Tobagonians | 0.0 /100 | #305 | Tragic 6.7% |
| Immigrants | Trinidad and Tobago | 0.0 /100 | #306 | Tragic 6.7% |
| Immigrants | Jamaica | 0.0 /100 | #307 | Tragic 6.7% |
| Aleuts | 0.0 /100 | #308 | Tragic 6.8% |
| Barbadians | 0.0 /100 | #309 | Tragic 6.9% |
| Blacks/African Americans | 0.0 /100 | #310 | Tragic 6.9% |
| Immigrants | Armenia | 0.0 /100 | #311 | Tragic 6.9% |
| Lumbee | 0.0 /100 | #312 | Tragic 6.9% |
| Immigrants | Dominica | 0.0 /100 | #313 | Tragic 7.0% |
| Immigrants | Barbados | 0.0 /100 | #314 | Tragic 7.1% |
| Houma | 0.0 /100 | #315 | Tragic 7.1% |
| Immigrants | Guyana | 0.0 /100 | #316 | Tragic 7.1% |
| Guyanese | 0.0 /100 | #317 | Tragic 7.1% |
| Cape Verdeans | 0.0 /100 | #318 | Tragic 7.1% |
| British West Indians | 0.0 /100 | #319 | Tragic 7.3% |