German Russian vs Immigrants from Romania Poverty
COMPARE
German Russian
Immigrants from Romania
Poverty
Poverty Comparison
German Russians
Immigrants from Romania
13.4%
POVERTY
2.2/ 100
METRIC RATING
225th/ 347
METRIC RANK
11.0%
POVERTY
98.9/ 100
METRIC RATING
47th/ 347
METRIC RANK
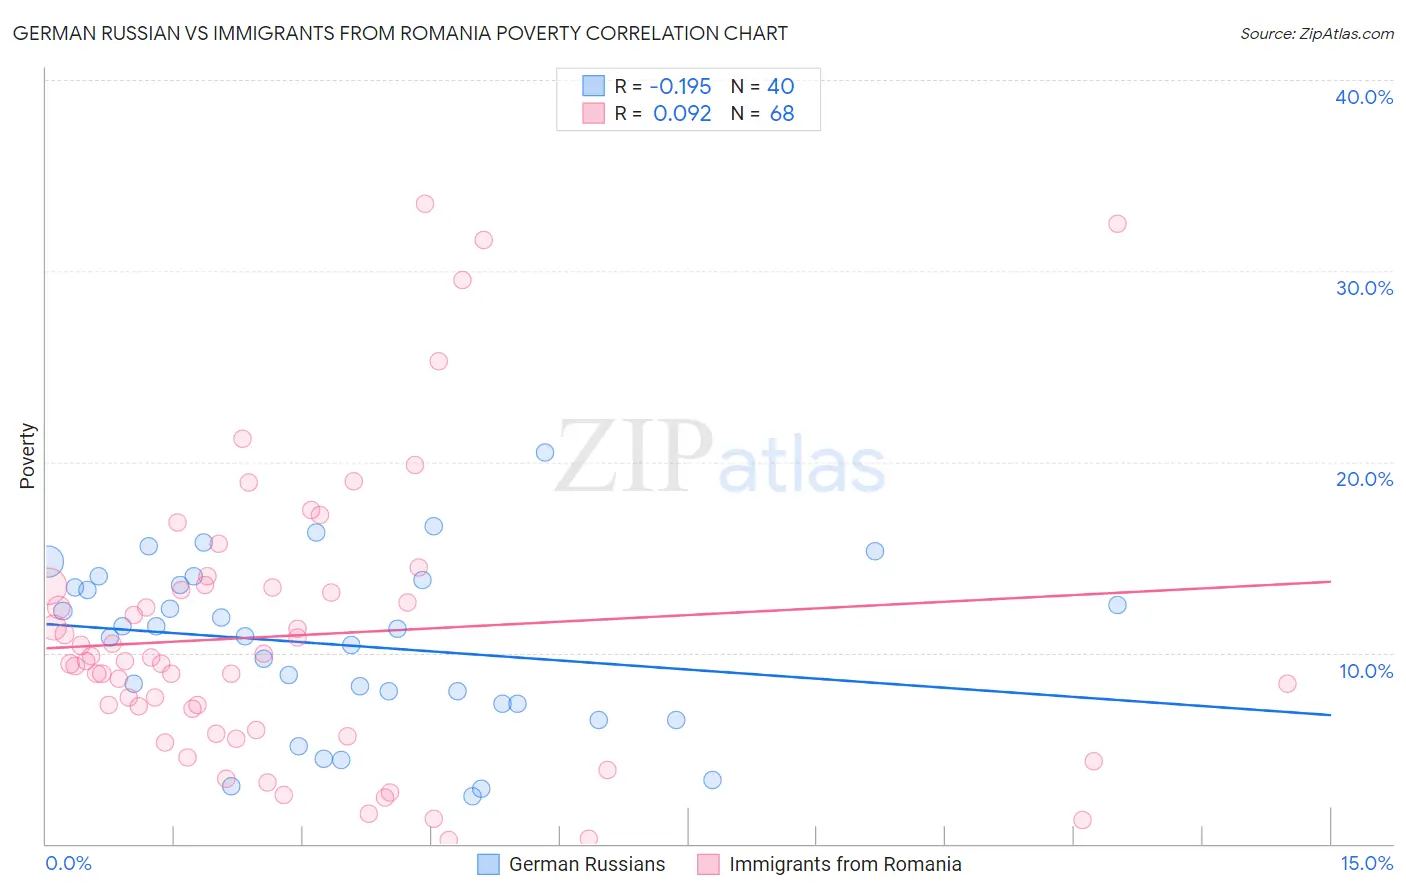
German Russian vs Immigrants from Romania Poverty Correlation Chart
The statistical analysis conducted on geographies consisting of 96,450,415 people shows a poor negative correlation between the proportion of German Russians and poverty level in the United States with a correlation coefficient (R) of -0.195 and weighted average of 13.4%. Similarly, the statistical analysis conducted on geographies consisting of 256,937,663 people shows a slight positive correlation between the proportion of Immigrants from Romania and poverty level in the United States with a correlation coefficient (R) of 0.092 and weighted average of 11.0%, a difference of 22.6%.
Poverty Correlation Summary
| Measurement | German Russian | Immigrants from Romania |
| Minimum | 2.5% | 0.19% |
| Maximum | 20.5% | 33.5% |
| Range | 18.0% | 33.4% |
| Mean | 10.4% | 10.9% |
| Median | 11.1% | 9.6% |
| Interquartile 25% (IQ1) | 7.3% | 5.9% |
| Interquartile 75% (IQ3) | 13.7% | 13.4% |
| Interquartile Range (IQR) | 6.4% | 7.6% |
| Standard Deviation (Sample) | 4.4% | 7.4% |
| Standard Deviation (Population) | 4.3% | 7.4% |
Similar Demographics by Poverty
Demographics Similar to German Russians by Poverty
In terms of poverty, the demographic groups most similar to German Russians are Marshallese (13.4%, a difference of 0.010%), Alaska Native (13.5%, a difference of 0.16%), Immigrants from Eritrea (13.4%, a difference of 0.22%), Immigrants from Africa (13.4%, a difference of 0.31%), and Immigrants from Micronesia (13.4%, a difference of 0.35%).
| Demographics | Rating | Rank | Poverty |
| Immigrants | Thailand | 3.1 /100 | #218 | Tragic 13.3% |
| Immigrants | Cambodia | 3.0 /100 | #219 | Tragic 13.4% |
| Americans | 2.9 /100 | #220 | Tragic 13.4% |
| Alsatians | 2.6 /100 | #221 | Tragic 13.4% |
| Immigrants | Micronesia | 2.6 /100 | #222 | Tragic 13.4% |
| Immigrants | Africa | 2.5 /100 | #223 | Tragic 13.4% |
| Immigrants | Eritrea | 2.4 /100 | #224 | Tragic 13.4% |
| German Russians | 2.2 /100 | #225 | Tragic 13.4% |
| Marshallese | 2.2 /100 | #226 | Tragic 13.4% |
| Alaska Natives | 2.1 /100 | #227 | Tragic 13.5% |
| Immigrants | Nigeria | 1.7 /100 | #228 | Tragic 13.5% |
| Osage | 1.5 /100 | #229 | Tragic 13.6% |
| Alaskan Athabascans | 1.5 /100 | #230 | Tragic 13.6% |
| Nigerians | 1.4 /100 | #231 | Tragic 13.6% |
| Fijians | 0.8 /100 | #232 | Tragic 13.7% |
Demographics Similar to Immigrants from Romania by Poverty
In terms of poverty, the demographic groups most similar to Immigrants from Romania are Immigrants from Czechoslovakia (11.0%, a difference of 0.010%), Slovene (11.0%, a difference of 0.050%), Immigrants from Japan (11.0%, a difference of 0.050%), Asian (11.0%, a difference of 0.080%), and Turkish (11.0%, a difference of 0.10%).
| Demographics | Rating | Rank | Poverty |
| Russians | 99.3 /100 | #40 | Exceptional 10.9% |
| Immigrants | Iran | 99.2 /100 | #41 | Exceptional 10.9% |
| Koreans | 99.2 /100 | #42 | Exceptional 10.9% |
| Immigrants | Singapore | 99.2 /100 | #43 | Exceptional 10.9% |
| Immigrants | Moldova | 99.1 /100 | #44 | Exceptional 10.9% |
| Turks | 98.9 /100 | #45 | Exceptional 11.0% |
| Immigrants | Czechoslovakia | 98.9 /100 | #46 | Exceptional 11.0% |
| Immigrants | Romania | 98.9 /100 | #47 | Exceptional 11.0% |
| Slovenes | 98.9 /100 | #48 | Exceptional 11.0% |
| Immigrants | Japan | 98.9 /100 | #49 | Exceptional 11.0% |
| Asians | 98.9 /100 | #50 | Exceptional 11.0% |
| Immigrants | Croatia | 98.7 /100 | #51 | Exceptional 11.0% |
| Immigrants | Philippines | 98.7 /100 | #52 | Exceptional 11.0% |
| Immigrants | Austria | 98.6 /100 | #53 | Exceptional 11.1% |
| Immigrants | Bulgaria | 98.5 /100 | #54 | Exceptional 11.1% |