Immigrants from Bolivia vs Immigrants from Romania Poverty
COMPARE
Immigrants from Bolivia
Immigrants from Romania
Poverty
Poverty Comparison
Immigrants from Bolivia
Immigrants from Romania
10.4%
POVERTY
99.8/ 100
METRIC RATING
14th/ 347
METRIC RANK
11.0%
POVERTY
98.9/ 100
METRIC RATING
47th/ 347
METRIC RANK
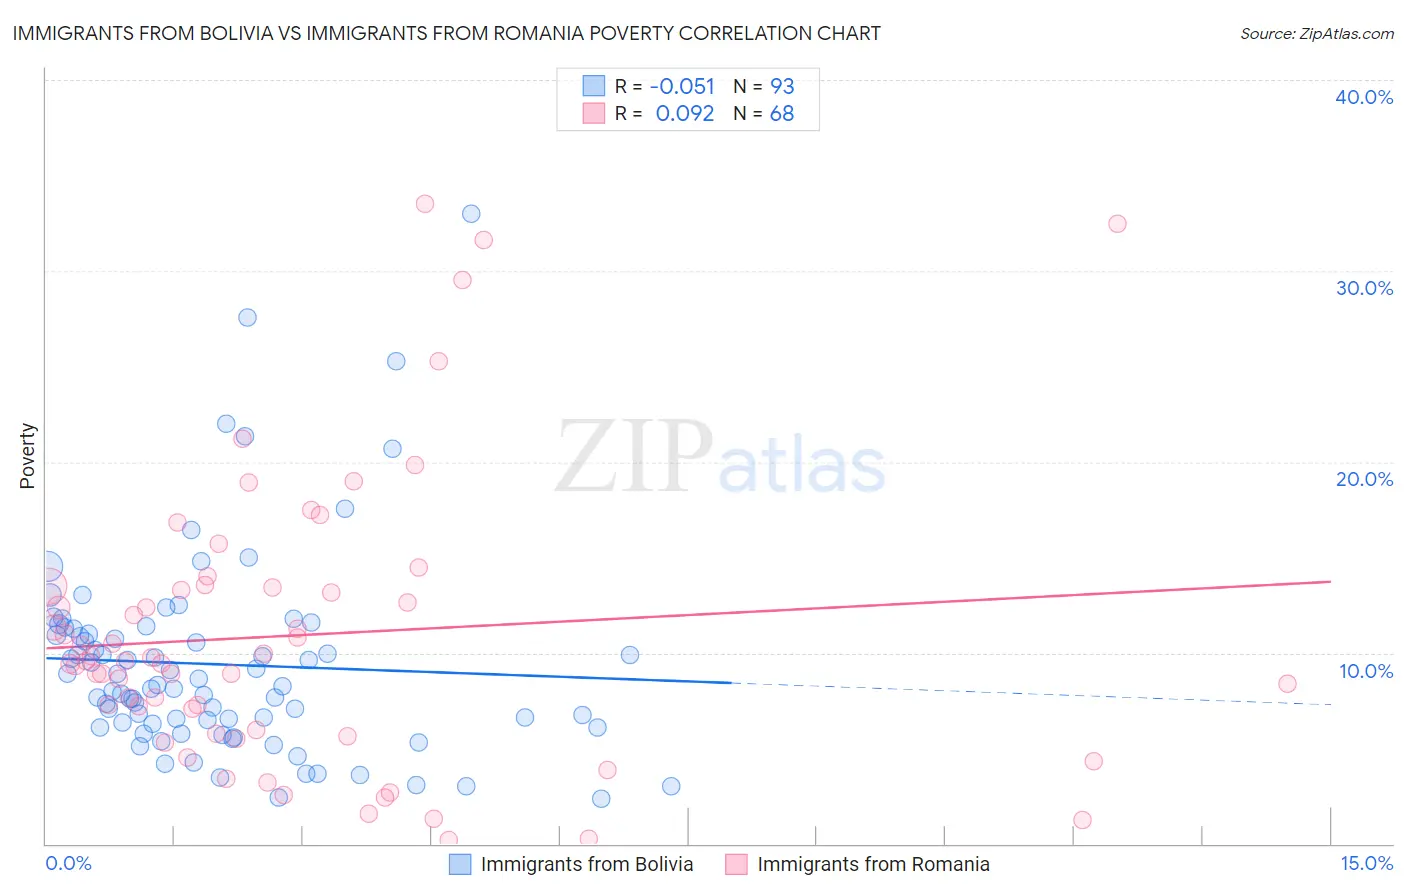
Immigrants from Bolivia vs Immigrants from Romania Poverty Correlation Chart
The statistical analysis conducted on geographies consisting of 158,712,653 people shows a slight negative correlation between the proportion of Immigrants from Bolivia and poverty level in the United States with a correlation coefficient (R) of -0.051 and weighted average of 10.4%. Similarly, the statistical analysis conducted on geographies consisting of 256,937,663 people shows a slight positive correlation between the proportion of Immigrants from Romania and poverty level in the United States with a correlation coefficient (R) of 0.092 and weighted average of 11.0%, a difference of 5.1%.
Poverty Correlation Summary
| Measurement | Immigrants from Bolivia | Immigrants from Romania |
| Minimum | 2.3% | 0.19% |
| Maximum | 33.0% | 33.5% |
| Range | 30.6% | 33.4% |
| Mean | 9.4% | 10.9% |
| Median | 8.2% | 9.6% |
| Interquartile 25% (IQ1) | 6.2% | 5.9% |
| Interquartile 75% (IQ3) | 11.1% | 13.4% |
| Interquartile Range (IQR) | 4.9% | 7.6% |
| Standard Deviation (Sample) | 5.3% | 7.4% |
| Standard Deviation (Population) | 5.3% | 7.4% |
Similar Demographics by Poverty
Demographics Similar to Immigrants from Bolivia by Poverty
In terms of poverty, the demographic groups most similar to Immigrants from Bolivia are Bolivian (10.4%, a difference of 0.010%), Immigrants from Hong Kong (10.4%, a difference of 0.31%), Lithuanian (10.5%, a difference of 0.31%), Bhutanese (10.4%, a difference of 0.53%), and Norwegian (10.5%, a difference of 0.68%).
| Demographics | Rating | Rank | Poverty |
| Filipinos | 99.9 /100 | #7 | Exceptional 10.1% |
| Maltese | 99.9 /100 | #8 | Exceptional 10.2% |
| Immigrants | South Central Asia | 99.9 /100 | #9 | Exceptional 10.2% |
| Bulgarians | 99.9 /100 | #10 | Exceptional 10.2% |
| Immigrants | Lithuania | 99.9 /100 | #11 | Exceptional 10.3% |
| Bhutanese | 99.8 /100 | #12 | Exceptional 10.4% |
| Immigrants | Hong Kong | 99.8 /100 | #13 | Exceptional 10.4% |
| Immigrants | Bolivia | 99.8 /100 | #14 | Exceptional 10.4% |
| Bolivians | 99.8 /100 | #15 | Exceptional 10.4% |
| Lithuanians | 99.8 /100 | #16 | Exceptional 10.5% |
| Norwegians | 99.8 /100 | #17 | Exceptional 10.5% |
| Latvians | 99.8 /100 | #18 | Exceptional 10.5% |
| Immigrants | Scotland | 99.7 /100 | #19 | Exceptional 10.6% |
| Immigrants | North Macedonia | 99.7 /100 | #20 | Exceptional 10.6% |
| Luxembourgers | 99.7 /100 | #21 | Exceptional 10.6% |
Demographics Similar to Immigrants from Romania by Poverty
In terms of poverty, the demographic groups most similar to Immigrants from Romania are Immigrants from Czechoslovakia (11.0%, a difference of 0.010%), Slovene (11.0%, a difference of 0.050%), Immigrants from Japan (11.0%, a difference of 0.050%), Asian (11.0%, a difference of 0.080%), and Turkish (11.0%, a difference of 0.10%).
| Demographics | Rating | Rank | Poverty |
| Russians | 99.3 /100 | #40 | Exceptional 10.9% |
| Immigrants | Iran | 99.2 /100 | #41 | Exceptional 10.9% |
| Koreans | 99.2 /100 | #42 | Exceptional 10.9% |
| Immigrants | Singapore | 99.2 /100 | #43 | Exceptional 10.9% |
| Immigrants | Moldova | 99.1 /100 | #44 | Exceptional 10.9% |
| Turks | 98.9 /100 | #45 | Exceptional 11.0% |
| Immigrants | Czechoslovakia | 98.9 /100 | #46 | Exceptional 11.0% |
| Immigrants | Romania | 98.9 /100 | #47 | Exceptional 11.0% |
| Slovenes | 98.9 /100 | #48 | Exceptional 11.0% |
| Immigrants | Japan | 98.9 /100 | #49 | Exceptional 11.0% |
| Asians | 98.9 /100 | #50 | Exceptional 11.0% |
| Immigrants | Croatia | 98.7 /100 | #51 | Exceptional 11.0% |
| Immigrants | Philippines | 98.7 /100 | #52 | Exceptional 11.0% |
| Immigrants | Austria | 98.6 /100 | #53 | Exceptional 11.1% |
| Immigrants | Bulgaria | 98.5 /100 | #54 | Exceptional 11.1% |