Immigrants from Cameroon vs Immigrants from Costa Rica Poverty
COMPARE
Immigrants from Cameroon
Immigrants from Costa Rica
Poverty
Poverty Comparison
Immigrants from Cameroon
Immigrants from Costa Rica
12.4%
POVERTY
41.7/ 100
METRIC RATING
182nd/ 347
METRIC RANK
12.5%
POVERTY
33.3/ 100
METRIC RATING
188th/ 347
METRIC RANK
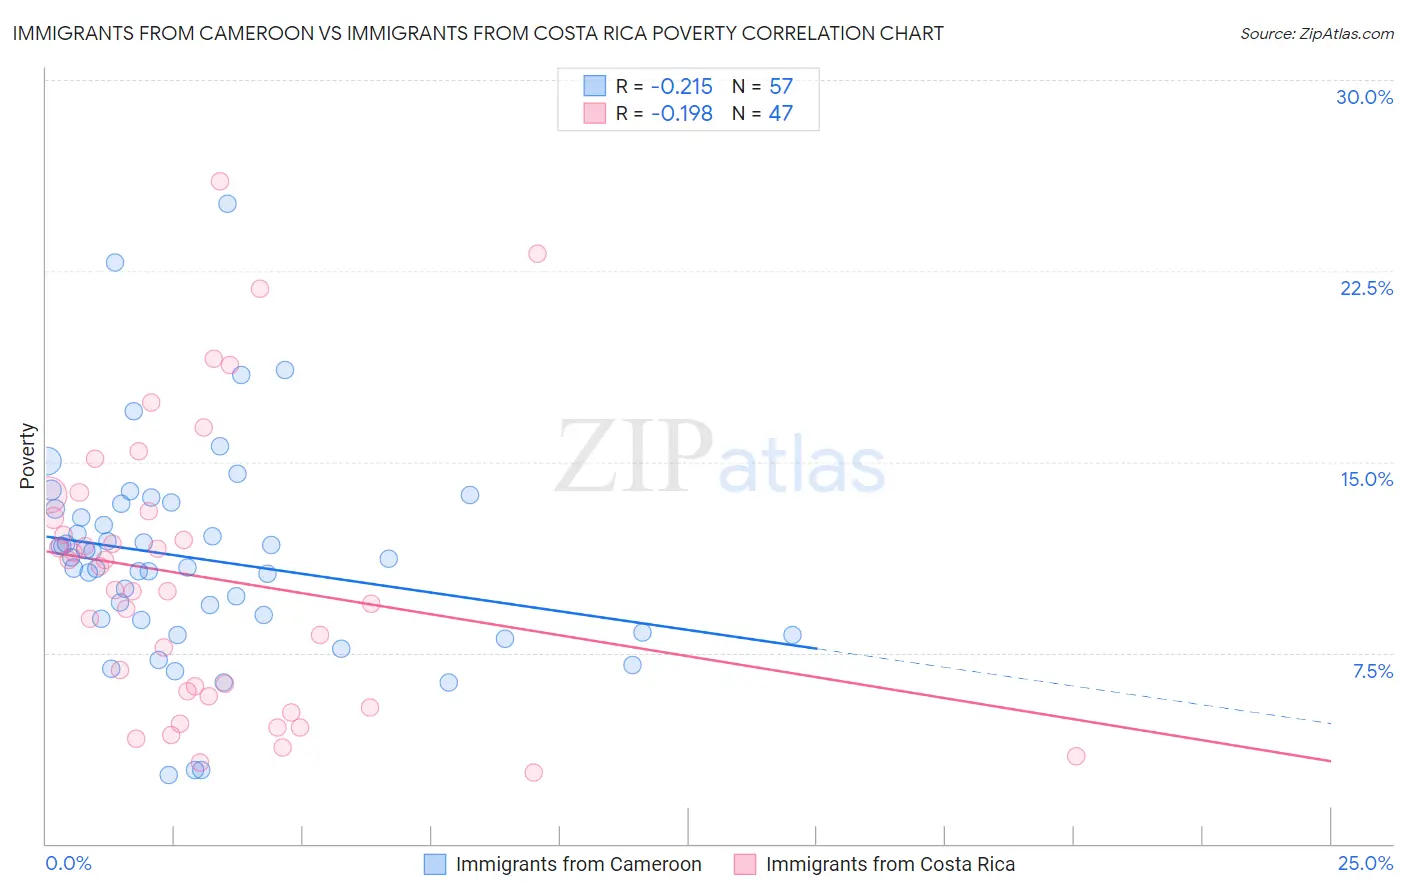
Immigrants from Cameroon vs Immigrants from Costa Rica Poverty Correlation Chart
The statistical analysis conducted on geographies consisting of 130,723,030 people shows a weak negative correlation between the proportion of Immigrants from Cameroon and poverty level in the United States with a correlation coefficient (R) of -0.215 and weighted average of 12.4%. Similarly, the statistical analysis conducted on geographies consisting of 204,257,913 people shows a poor negative correlation between the proportion of Immigrants from Costa Rica and poverty level in the United States with a correlation coefficient (R) of -0.198 and weighted average of 12.5%, a difference of 0.87%.
Poverty Correlation Summary
| Measurement | Immigrants from Cameroon | Immigrants from Costa Rica |
| Minimum | 2.7% | 2.8% |
| Maximum | 25.1% | 26.0% |
| Range | 22.4% | 23.2% |
| Mean | 11.2% | 10.5% |
| Median | 11.2% | 10.0% |
| Interquartile 25% (IQ1) | 8.5% | 5.8% |
| Interquartile 75% (IQ3) | 13.2% | 13.1% |
| Interquartile Range (IQR) | 4.7% | 7.3% |
| Standard Deviation (Sample) | 4.2% | 5.5% |
| Standard Deviation (Population) | 4.1% | 5.5% |
Demographics Similar to Immigrants from Cameroon and Immigrants from Costa Rica by Poverty
In terms of poverty, the demographic groups most similar to Immigrants from Cameroon are Immigrants from Afghanistan (12.4%, a difference of 0.040%), Immigrants from Iraq (12.4%, a difference of 0.15%), Mongolian (12.4%, a difference of 0.19%), Immigrants from Morocco (12.4%, a difference of 0.23%), and Uruguayan (12.4%, a difference of 0.29%). Similarly, the demographic groups most similar to Immigrants from Costa Rica are Aleut (12.5%, a difference of 0.010%), Hawaiian (12.5%, a difference of 0.090%), Immigrants from South America (12.5%, a difference of 0.10%), Sierra Leonean (12.6%, a difference of 0.20%), and Immigrants from Sierra Leone (12.5%, a difference of 0.32%).
| Demographics | Rating | Rank | Poverty |
| South Americans | 48.7 /100 | #175 | Average 12.3% |
| Immigrants | Colombia | 47.7 /100 | #176 | Average 12.3% |
| Immigrants | Syria | 47.5 /100 | #177 | Average 12.3% |
| Uruguayans | 44.7 /100 | #178 | Average 12.4% |
| Immigrants | Morocco | 44.0 /100 | #179 | Average 12.4% |
| Mongolians | 43.6 /100 | #180 | Average 12.4% |
| Immigrants | Afghanistan | 42.1 /100 | #181 | Average 12.4% |
| Immigrants | Cameroon | 41.7 /100 | #182 | Average 12.4% |
| Immigrants | Iraq | 40.2 /100 | #183 | Average 12.4% |
| Kenyans | 38.8 /100 | #184 | Fair 12.5% |
| Israelis | 36.4 /100 | #185 | Fair 12.5% |
| Immigrants | Sierra Leone | 36.3 /100 | #186 | Fair 12.5% |
| Hawaiians | 34.1 /100 | #187 | Fair 12.5% |
| Immigrants | Costa Rica | 33.3 /100 | #188 | Fair 12.5% |
| Aleuts | 33.2 /100 | #189 | Fair 12.5% |
| Immigrants | South America | 32.3 /100 | #190 | Fair 12.5% |
| Sierra Leoneans | 31.5 /100 | #191 | Fair 12.6% |
| South American Indians | 23.3 /100 | #192 | Fair 12.7% |
| Delaware | 21.4 /100 | #193 | Fair 12.7% |
| Arabs | 21.1 /100 | #194 | Fair 12.7% |
| Immigrants | Kuwait | 20.9 /100 | #195 | Fair 12.7% |